Immigrants from St. Vincent and the Grenadines vs Somali Births to Unmarried Women
COMPARE
Immigrants from St. Vincent and the Grenadines
Somali
Births to Unmarried Women
Births to Unmarried Women Comparison
Immigrants from St. Vincent and the Grenadines
Somalis
37.3%
BIRTHS TO UNMARRIED WOMEN
0.1/ 100
METRIC RATING
280th/ 347
METRIC RANK
30.7%
BIRTHS TO UNMARRIED WOMEN
77.8/ 100
METRIC RATING
150th/ 347
METRIC RANK
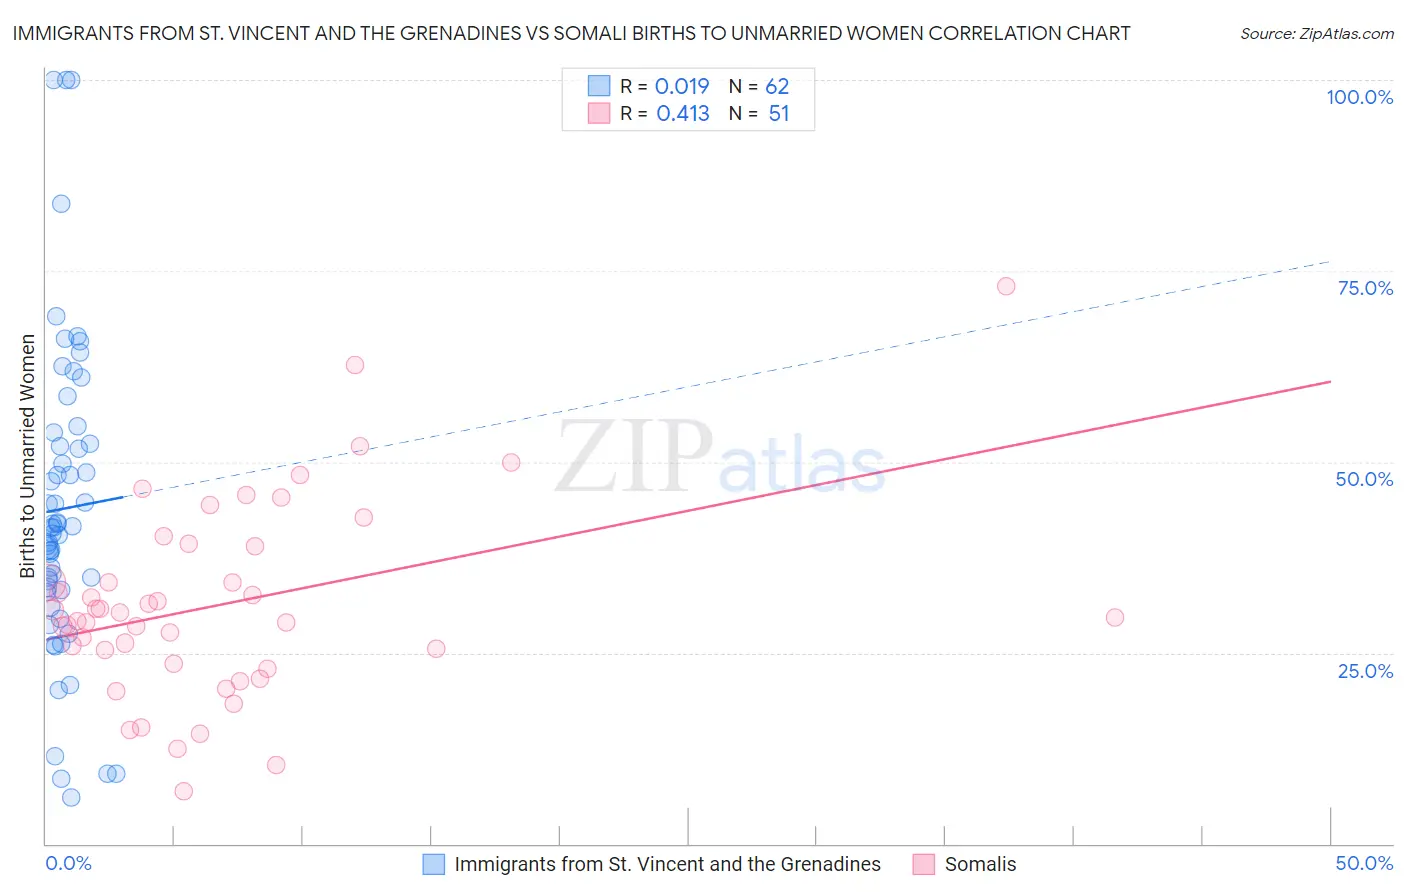
Immigrants from St. Vincent and the Grenadines vs Somali Births to Unmarried Women Correlation Chart
The statistical analysis conducted on geographies consisting of 55,457,752 people shows no correlation between the proportion of Immigrants from St. Vincent and the Grenadines and percentage of births to unmarried women in the United States with a correlation coefficient (R) of 0.019 and weighted average of 37.3%. Similarly, the statistical analysis conducted on geographies consisting of 97,449,396 people shows a moderate positive correlation between the proportion of Somalis and percentage of births to unmarried women in the United States with a correlation coefficient (R) of 0.413 and weighted average of 30.7%, a difference of 21.4%.
Births to Unmarried Women Correlation Summary
| Measurement | Immigrants from St. Vincent and the Grenadines | Somali |
| Minimum | 6.0% | 6.8% |
| Maximum | 100.0% | 73.0% |
| Range | 94.0% | 66.2% |
| Mean | 43.9% | 31.3% |
| Median | 41.5% | 29.7% |
| Interquartile 25% (IQ1) | 33.3% | 23.6% |
| Interquartile 75% (IQ3) | 52.4% | 39.0% |
| Interquartile Range (IQR) | 19.1% | 15.4% |
| Standard Deviation (Sample) | 20.4% | 12.7% |
| Standard Deviation (Population) | 20.2% | 12.6% |
Similar Demographics by Births to Unmarried Women
Demographics Similar to Immigrants from St. Vincent and the Grenadines by Births to Unmarried Women
In terms of births to unmarried women, the demographic groups most similar to Immigrants from St. Vincent and the Grenadines are Immigrants from Belize (37.3%, a difference of 0.020%), West Indian (37.3%, a difference of 0.12%), Liberian (37.4%, a difference of 0.18%), Spanish American Indian (37.4%, a difference of 0.26%), and Immigrants from Central America (37.4%, a difference of 0.33%).
| Demographics | Rating | Rank | Births to Unmarried Women |
| Mexicans | 0.1 /100 | #273 | Tragic 36.9% |
| Cree | 0.1 /100 | #274 | Tragic 37.0% |
| Barbadians | 0.1 /100 | #275 | Tragic 37.0% |
| Belizeans | 0.1 /100 | #276 | Tragic 37.0% |
| Guatemalans | 0.1 /100 | #277 | Tragic 37.1% |
| Immigrants | Latin America | 0.1 /100 | #278 | Tragic 37.1% |
| West Indians | 0.1 /100 | #279 | Tragic 37.3% |
| Immigrants | St. Vincent and the Grenadines | 0.1 /100 | #280 | Tragic 37.3% |
| Immigrants | Belize | 0.1 /100 | #281 | Tragic 37.3% |
| Liberians | 0.0 /100 | #282 | Tragic 37.4% |
| Spanish American Indians | 0.0 /100 | #283 | Tragic 37.4% |
| Immigrants | Central America | 0.0 /100 | #284 | Tragic 37.4% |
| Immigrants | Mexico | 0.0 /100 | #285 | Tragic 37.5% |
| Immigrants | Guatemala | 0.0 /100 | #286 | Tragic 37.5% |
| Creek | 0.0 /100 | #287 | Tragic 37.6% |
Demographics Similar to Somalis by Births to Unmarried Women
In terms of births to unmarried women, the demographic groups most similar to Somalis are Italian (30.8%, a difference of 0.11%), Serbian (30.7%, a difference of 0.14%), Chilean (30.7%, a difference of 0.19%), Polish (30.8%, a difference of 0.22%), and British (30.8%, a difference of 0.24%).
| Demographics | Rating | Rank | Births to Unmarried Women |
| Immigrants | Uganda | 82.6 /100 | #143 | Excellent 30.5% |
| Czechs | 82.1 /100 | #144 | Excellent 30.5% |
| Immigrants | North America | 81.5 /100 | #145 | Excellent 30.6% |
| Northern Europeans | 81.4 /100 | #146 | Excellent 30.6% |
| Immigrants | Oceania | 81.2 /100 | #147 | Excellent 30.6% |
| Chileans | 79.1 /100 | #148 | Good 30.7% |
| Serbians | 78.8 /100 | #149 | Good 30.7% |
| Somalis | 77.8 /100 | #150 | Good 30.7% |
| Italians | 77.0 /100 | #151 | Good 30.8% |
| Poles | 76.2 /100 | #152 | Good 30.8% |
| British | 76.0 /100 | #153 | Good 30.8% |
| Yugoslavians | 75.1 /100 | #154 | Good 30.8% |
| Immigrants | Bangladesh | 73.9 /100 | #155 | Good 30.9% |
| Carpatho Rusyns | 73.5 /100 | #156 | Good 30.9% |
| Immigrants | Eastern Africa | 72.1 /100 | #157 | Good 31.0% |