Immigrants from Spain vs Lithuanian Single Mother Households
COMPARE
Immigrants from Spain
Lithuanian
Single Mother Households
Single Mother Households Comparison
Immigrants from Spain
Lithuanians
5.9%
SINGLE MOTHER HOUSEHOLDS
91.2/ 100
METRIC RATING
131st/ 347
METRIC RANK
5.4%
SINGLE MOTHER HOUSEHOLDS
99.4/ 100
METRIC RATING
44th/ 347
METRIC RANK
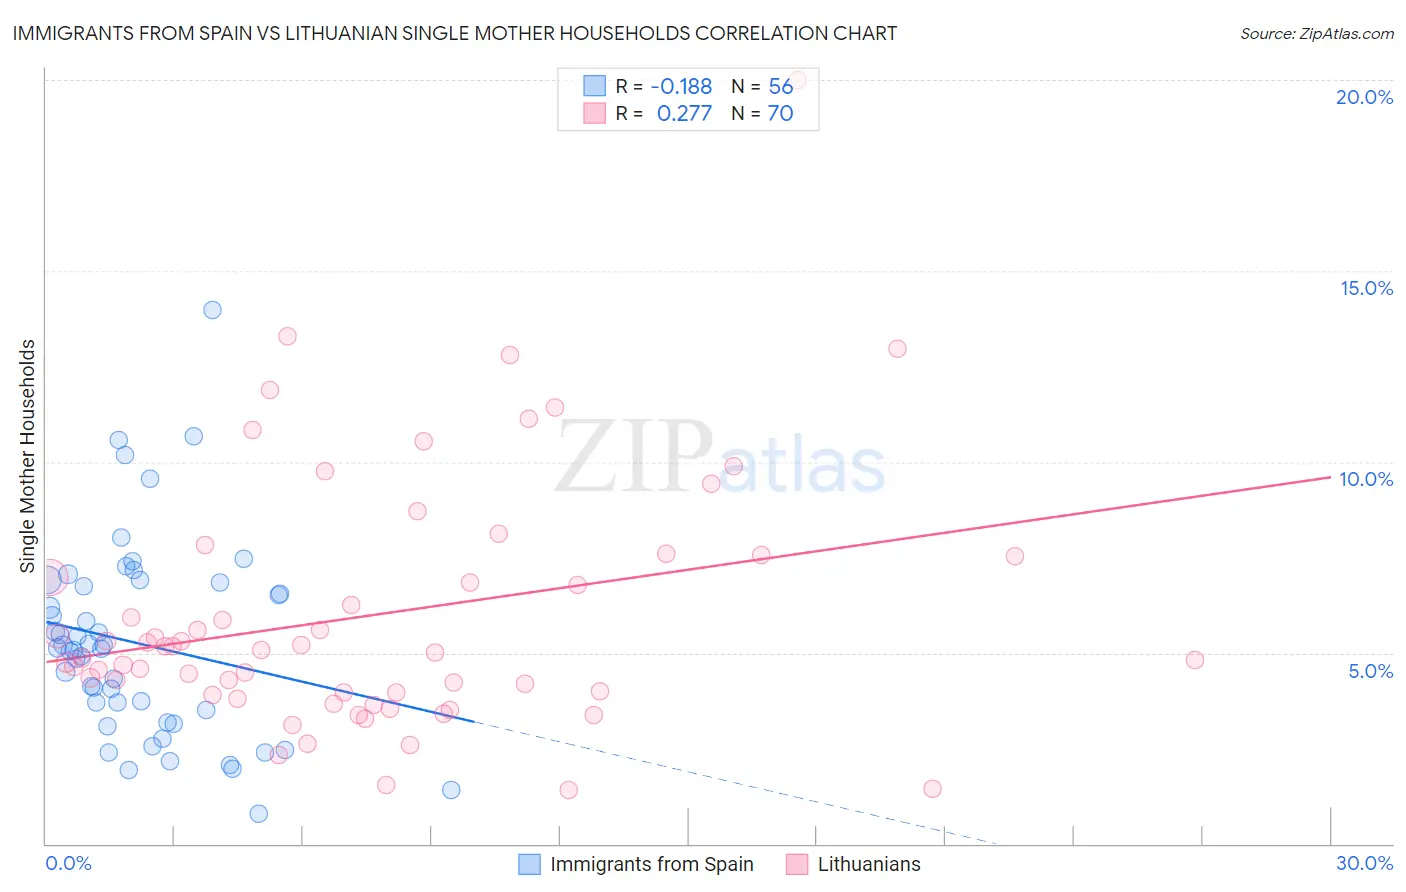
Immigrants from Spain vs Lithuanian Single Mother Households Correlation Chart
The statistical analysis conducted on geographies consisting of 239,327,015 people shows a poor negative correlation between the proportion of Immigrants from Spain and percentage of single mother households in the United States with a correlation coefficient (R) of -0.188 and weighted average of 5.9%. Similarly, the statistical analysis conducted on geographies consisting of 420,116,191 people shows a weak positive correlation between the proportion of Lithuanians and percentage of single mother households in the United States with a correlation coefficient (R) of 0.277 and weighted average of 5.4%, a difference of 8.7%.
Single Mother Households Correlation Summary
| Measurement | Immigrants from Spain | Lithuanian |
| Minimum | 0.79% | 1.4% |
| Maximum | 14.0% | 20.0% |
| Range | 13.2% | 18.6% |
| Mean | 5.2% | 6.0% |
| Median | 5.1% | 5.0% |
| Interquartile 25% (IQ1) | 3.3% | 4.0% |
| Interquartile 75% (IQ3) | 6.8% | 7.5% |
| Interquartile Range (IQR) | 3.5% | 3.6% |
| Standard Deviation (Sample) | 2.6% | 3.3% |
| Standard Deviation (Population) | 2.5% | 3.3% |
Similar Demographics by Single Mother Households
Demographics Similar to Immigrants from Spain by Single Mother Households
In terms of single mother households, the demographic groups most similar to Immigrants from Spain are Albanian (5.9%, a difference of 0.040%), Egyptian (5.9%, a difference of 0.20%), Canadian (5.9%, a difference of 0.26%), Palestinian (5.9%, a difference of 0.35%), and Immigrants from Saudi Arabia (5.9%, a difference of 0.35%).
| Demographics | Rating | Rank | Single Mother Households |
| Immigrants | Argentina | 93.2 /100 | #124 | Exceptional 5.9% |
| Slavs | 92.9 /100 | #125 | Exceptional 5.9% |
| Welsh | 92.8 /100 | #126 | Exceptional 5.9% |
| Lebanese | 92.4 /100 | #127 | Exceptional 5.9% |
| Czechoslovakians | 92.2 /100 | #128 | Exceptional 5.9% |
| Immigrants | Bolivia | 92.2 /100 | #129 | Exceptional 5.9% |
| Palestinians | 92.1 /100 | #130 | Exceptional 5.9% |
| Immigrants | Spain | 91.2 /100 | #131 | Exceptional 5.9% |
| Albanians | 91.1 /100 | #132 | Exceptional 5.9% |
| Egyptians | 90.7 /100 | #133 | Exceptional 5.9% |
| Canadians | 90.5 /100 | #134 | Exceptional 5.9% |
| Immigrants | Saudi Arabia | 90.2 /100 | #135 | Exceptional 5.9% |
| Jordanians | 88.9 /100 | #136 | Excellent 6.0% |
| Immigrants | Pakistan | 88.4 /100 | #137 | Excellent 6.0% |
| Icelanders | 86.9 /100 | #138 | Excellent 6.0% |
Demographics Similar to Lithuanians by Single Mother Households
In terms of single mother households, the demographic groups most similar to Lithuanians are Immigrants from Croatia (5.4%, a difference of 0.12%), Croatian (5.5%, a difference of 0.38%), Norwegian (5.5%, a difference of 0.56%), Immigrants from South Central Asia (5.4%, a difference of 0.70%), and Macedonian (5.4%, a difference of 0.76%).
| Demographics | Rating | Rank | Single Mother Households |
| Immigrants | Belgium | 99.7 /100 | #37 | Exceptional 5.3% |
| Immigrants | Serbia | 99.6 /100 | #38 | Exceptional 5.4% |
| Immigrants | Sweden | 99.6 /100 | #39 | Exceptional 5.4% |
| Estonians | 99.6 /100 | #40 | Exceptional 5.4% |
| Immigrants | Greece | 99.5 /100 | #41 | Exceptional 5.4% |
| Macedonians | 99.5 /100 | #42 | Exceptional 5.4% |
| Immigrants | South Central Asia | 99.5 /100 | #43 | Exceptional 5.4% |
| Lithuanians | 99.4 /100 | #44 | Exceptional 5.4% |
| Immigrants | Croatia | 99.4 /100 | #45 | Exceptional 5.4% |
| Croatians | 99.3 /100 | #46 | Exceptional 5.5% |
| Norwegians | 99.3 /100 | #47 | Exceptional 5.5% |
| Turks | 99.2 /100 | #48 | Exceptional 5.5% |
| Immigrants | Latvia | 99.2 /100 | #49 | Exceptional 5.5% |
| Immigrants | Scotland | 99.2 /100 | #50 | Exceptional 5.5% |
| Immigrants | Belarus | 99.2 /100 | #51 | Exceptional 5.5% |