Immigrants from Spain vs Hopi 9th Grade
COMPARE
Immigrants from Spain
Hopi
9th Grade
9th Grade Comparison
Immigrants from Spain
Hopi
94.9%
9TH GRADE
49.1/ 100
METRIC RATING
176th/ 347
METRIC RANK
94.8%
9TH GRADE
37.1/ 100
METRIC RATING
186th/ 347
METRIC RANK
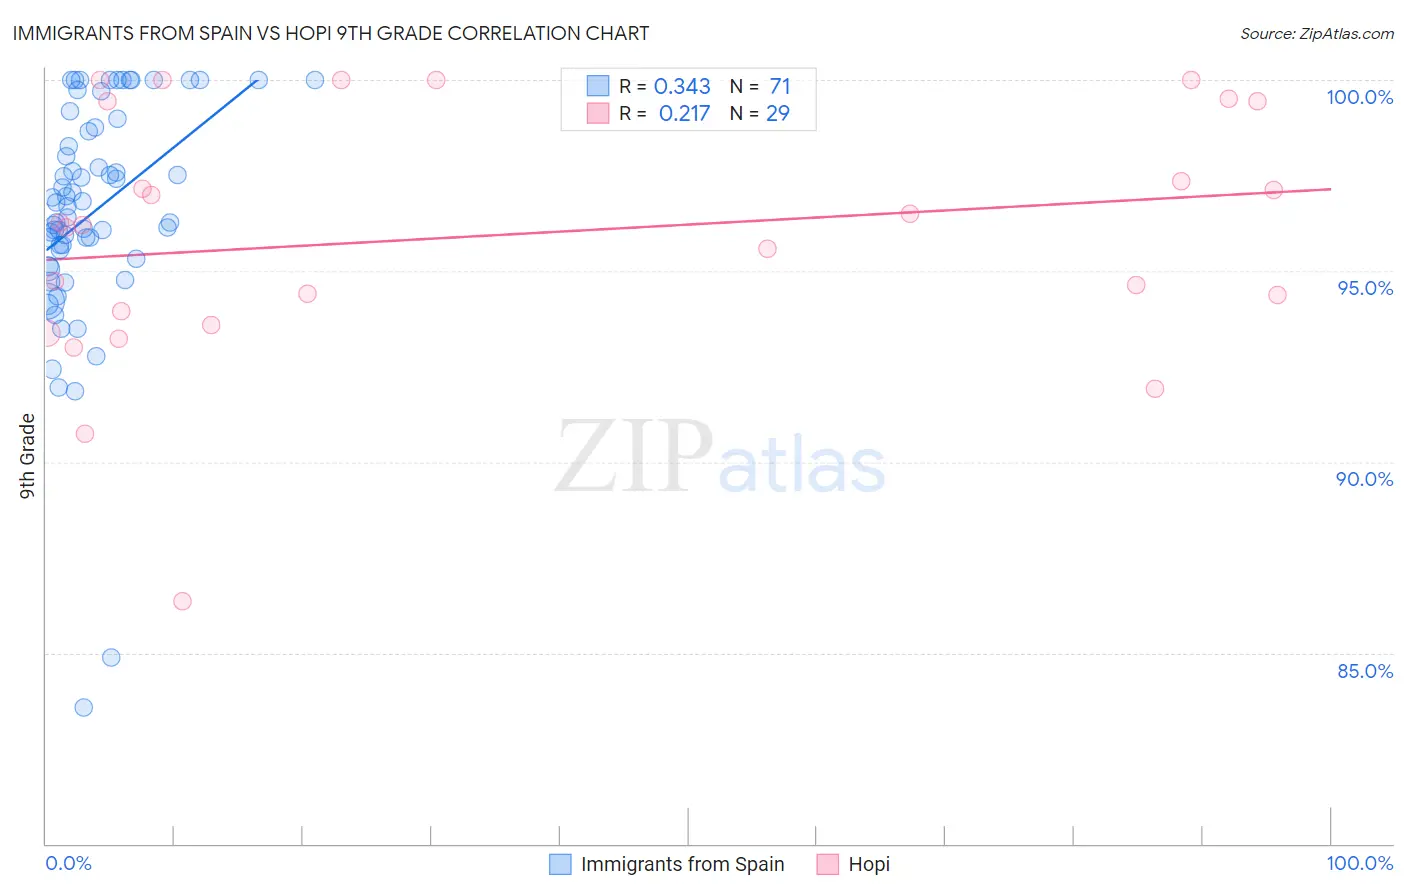
Immigrants from Spain vs Hopi 9th Grade Correlation Chart
The statistical analysis conducted on geographies consisting of 239,621,997 people shows a mild positive correlation between the proportion of Immigrants from Spain and percentage of population with at least 9th grade education in the United States with a correlation coefficient (R) of 0.343 and weighted average of 94.9%. Similarly, the statistical analysis conducted on geographies consisting of 74,739,957 people shows a weak positive correlation between the proportion of Hopi and percentage of population with at least 9th grade education in the United States with a correlation coefficient (R) of 0.217 and weighted average of 94.8%, a difference of 0.090%.
9th Grade Correlation Summary
| Measurement | Immigrants from Spain | Hopi |
| Minimum | 83.6% | 86.4% |
| Maximum | 100.0% | 100.0% |
| Range | 16.4% | 13.6% |
| Mean | 96.5% | 95.9% |
| Median | 96.7% | 96.2% |
| Interquartile 25% (IQ1) | 95.3% | 93.8% |
| Interquartile 75% (IQ3) | 98.8% | 99.4% |
| Interquartile Range (IQR) | 3.4% | 5.7% |
| Standard Deviation (Sample) | 3.1% | 3.3% |
| Standard Deviation (Population) | 3.0% | 3.2% |
Demographics Similar to Immigrants from Spain and Hopi by 9th Grade
In terms of 9th grade, the demographic groups most similar to Immigrants from Spain are Immigrants from Egypt (94.9%, a difference of 0.010%), Brazilian (94.9%, a difference of 0.010%), Immigrants from Iraq (94.9%, a difference of 0.010%), Cheyenne (94.9%, a difference of 0.020%), and Immigrants from Poland (94.9%, a difference of 0.020%). Similarly, the demographic groups most similar to Hopi are Argentinean (94.8%, a difference of 0.0%), Liberian (94.8%, a difference of 0.0%), Guamanian/Chamorro (94.8%, a difference of 0.010%), Immigrants from Nepal (94.8%, a difference of 0.020%), and Immigrants from Albania (94.8%, a difference of 0.020%).
| Demographics | Rating | Rank | 9th Grade |
| Colville | 58.5 /100 | #171 | Average 94.9% |
| Iraqis | 54.0 /100 | #172 | Average 94.9% |
| Cheyenne | 51.5 /100 | #173 | Average 94.9% |
| Immigrants | Egypt | 50.0 /100 | #174 | Average 94.9% |
| Brazilians | 49.8 /100 | #175 | Average 94.9% |
| Immigrants | Spain | 49.1 /100 | #176 | Average 94.9% |
| Immigrants | Iraq | 47.8 /100 | #177 | Average 94.9% |
| Immigrants | Poland | 46.7 /100 | #178 | Average 94.9% |
| Immigrants | Venezuela | 46.5 /100 | #179 | Average 94.9% |
| Immigrants | Uganda | 43.1 /100 | #180 | Average 94.8% |
| Sierra Leoneans | 42.7 /100 | #181 | Average 94.8% |
| Seminole | 42.5 /100 | #182 | Average 94.8% |
| Immigrants | Nepal | 39.7 /100 | #183 | Fair 94.8% |
| Argentineans | 37.6 /100 | #184 | Fair 94.8% |
| Liberians | 37.4 /100 | #185 | Fair 94.8% |
| Hopi | 37.1 /100 | #186 | Fair 94.8% |
| Guamanians/Chamorros | 35.5 /100 | #187 | Fair 94.8% |
| Immigrants | Albania | 34.5 /100 | #188 | Fair 94.8% |
| Immigrants | Argentina | 34.4 /100 | #189 | Fair 94.8% |
| Sudanese | 32.7 /100 | #190 | Fair 94.7% |
| Assyrians/Chaldeans/Syriacs | 32.0 /100 | #191 | Fair 94.7% |