Immigrants from South America vs Soviet Union Single Father Households
COMPARE
Immigrants from South America
Soviet Union
Single Father Households
Single Father Households Comparison
Immigrants from South America
Soviet Union
2.3%
SINGLE FATHER HOUSEHOLDS
79.9/ 100
METRIC RATING
156th/ 347
METRIC RANK
1.8%
SINGLE FATHER HOUSEHOLDS
100.0/ 100
METRIC RATING
1st/ 347
METRIC RANK
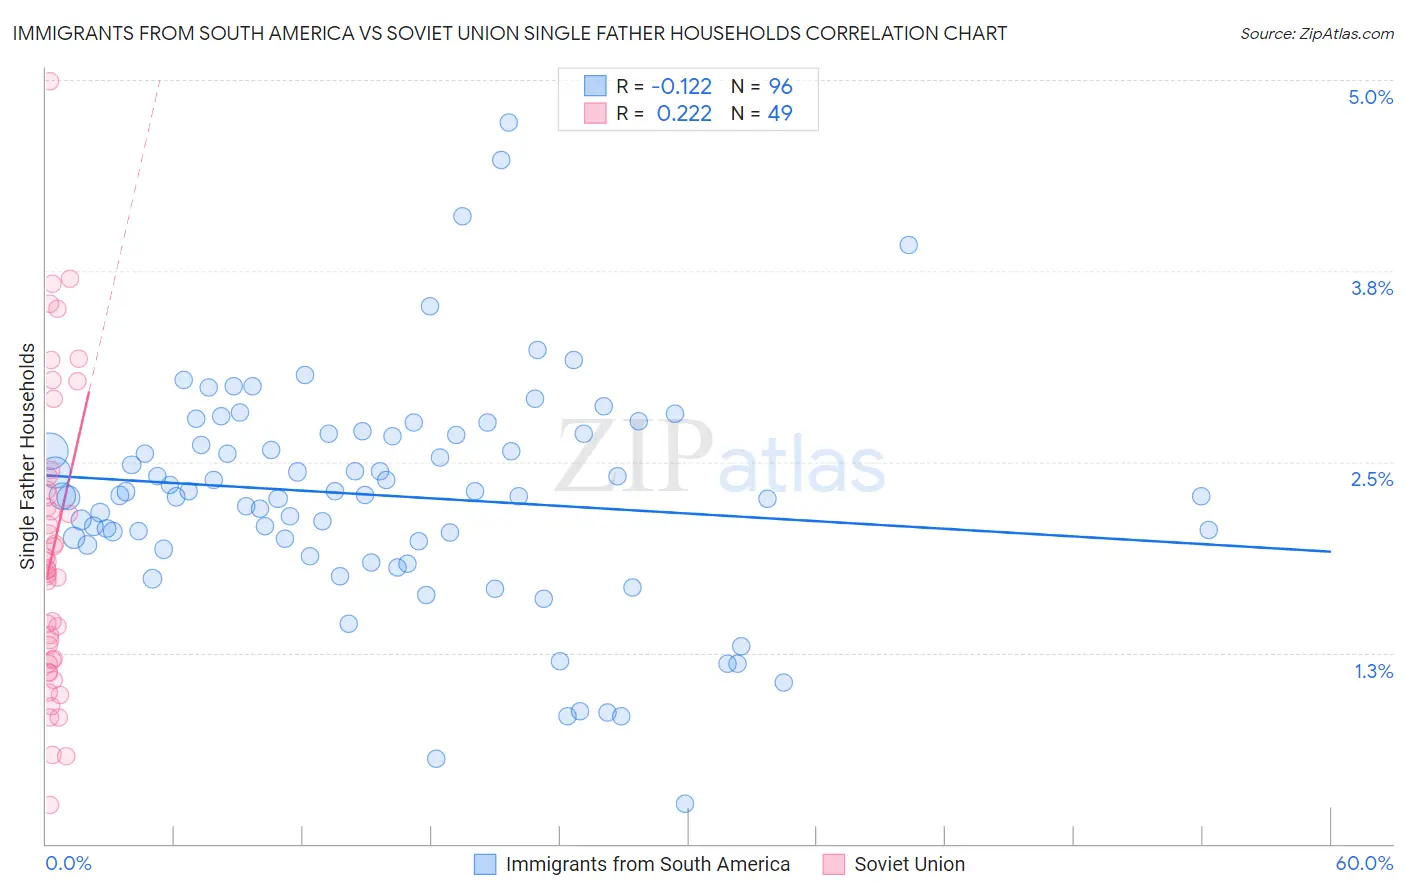
Immigrants from South America vs Soviet Union Single Father Households Correlation Chart
The statistical analysis conducted on geographies consisting of 479,744,076 people shows a poor negative correlation between the proportion of Immigrants from South America and percentage of single father households in the United States with a correlation coefficient (R) of -0.122 and weighted average of 2.3%. Similarly, the statistical analysis conducted on geographies consisting of 43,425,505 people shows a weak positive correlation between the proportion of Soviet Union and percentage of single father households in the United States with a correlation coefficient (R) of 0.222 and weighted average of 1.8%, a difference of 27.0%.
Single Father Households Correlation Summary
| Measurement | Immigrants from South America | Soviet Union |
| Minimum | 0.26% | 0.25% |
| Maximum | 4.7% | 5.0% |
| Range | 4.5% | 4.7% |
| Mean | 2.3% | 1.9% |
| Median | 2.3% | 1.8% |
| Interquartile 25% (IQ1) | 2.0% | 1.2% |
| Interquartile 75% (IQ3) | 2.7% | 2.4% |
| Interquartile Range (IQR) | 0.71% | 1.2% |
| Standard Deviation (Sample) | 0.75% | 0.97% |
| Standard Deviation (Population) | 0.74% | 0.96% |
Similar Demographics by Single Father Households
Demographics Similar to Immigrants from South America by Single Father Households
In terms of single father households, the demographic groups most similar to Immigrants from South America are Canadian (2.3%, a difference of 0.020%), Immigrants from Senegal (2.3%, a difference of 0.050%), European (2.3%, a difference of 0.12%), Bolivian (2.3%, a difference of 0.14%), and Immigrants from West Indies (2.3%, a difference of 0.22%).
| Demographics | Rating | Rank | Single Father Households |
| Senegalese | 88.4 /100 | #149 | Excellent 2.3% |
| Venezuelans | 86.2 /100 | #150 | Excellent 2.3% |
| Immigrants | Syria | 84.8 /100 | #151 | Excellent 2.3% |
| Immigrants | Venezuela | 83.2 /100 | #152 | Excellent 2.3% |
| Immigrants | Germany | 82.8 /100 | #153 | Excellent 2.3% |
| Bolivians | 81.0 /100 | #154 | Excellent 2.3% |
| Europeans | 80.9 /100 | #155 | Excellent 2.3% |
| Immigrants | South America | 79.9 /100 | #156 | Good 2.3% |
| Canadians | 79.7 /100 | #157 | Good 2.3% |
| Immigrants | Senegal | 79.4 /100 | #158 | Good 2.3% |
| Immigrants | West Indies | 77.9 /100 | #159 | Good 2.3% |
| Immigrants | Bolivia | 76.3 /100 | #160 | Good 2.3% |
| Swiss | 73.2 /100 | #161 | Good 2.3% |
| Scottish | 72.8 /100 | #162 | Good 2.3% |
| Irish | 72.1 /100 | #163 | Good 2.3% |
Demographics Similar to Soviet Union by Single Father Households
In terms of single father households, the demographic groups most similar to Soviet Union are Immigrants from Israel (1.8%, a difference of 0.040%), Filipino (1.8%, a difference of 0.46%), Immigrants from Uzbekistan (1.8%, a difference of 1.1%), Immigrants from Hong Kong (1.8%, a difference of 2.1%), and Immigrants from Taiwan (1.8%, a difference of 2.5%).
| Demographics | Rating | Rank | Single Father Households |
| Soviet Union | 100.0 /100 | #1 | Exceptional 1.8% |
| Immigrants | Israel | 100.0 /100 | #2 | Exceptional 1.8% |
| Filipinos | 100.0 /100 | #3 | Exceptional 1.8% |
| Immigrants | Uzbekistan | 100.0 /100 | #4 | Exceptional 1.8% |
| Immigrants | Hong Kong | 100.0 /100 | #5 | Exceptional 1.8% |
| Immigrants | Taiwan | 100.0 /100 | #6 | Exceptional 1.8% |
| Cypriots | 100.0 /100 | #7 | Exceptional 1.8% |
| Immigrants | Ireland | 100.0 /100 | #8 | Exceptional 1.8% |
| Immigrants | China | 100.0 /100 | #9 | Exceptional 1.8% |
| Okinawans | 100.0 /100 | #10 | Exceptional 1.9% |
| Immigrants | Belarus | 100.0 /100 | #11 | Exceptional 1.9% |
| Immigrants | Greece | 100.0 /100 | #12 | Exceptional 1.9% |
| Immigrants | Singapore | 100.0 /100 | #13 | Exceptional 1.9% |
| Immigrants | Lithuania | 100.0 /100 | #14 | Exceptional 1.9% |
| Immigrants | Eastern Asia | 100.0 /100 | #15 | Exceptional 1.9% |