Immigrants from South America vs Pueblo Single Father Households
COMPARE
Immigrants from South America
Pueblo
Single Father Households
Single Father Households Comparison
Immigrants from South America
Pueblo
2.3%
SINGLE FATHER HOUSEHOLDS
79.9/ 100
METRIC RATING
156th/ 347
METRIC RANK
3.3%
SINGLE FATHER HOUSEHOLDS
0.0/ 100
METRIC RATING
337th/ 347
METRIC RANK
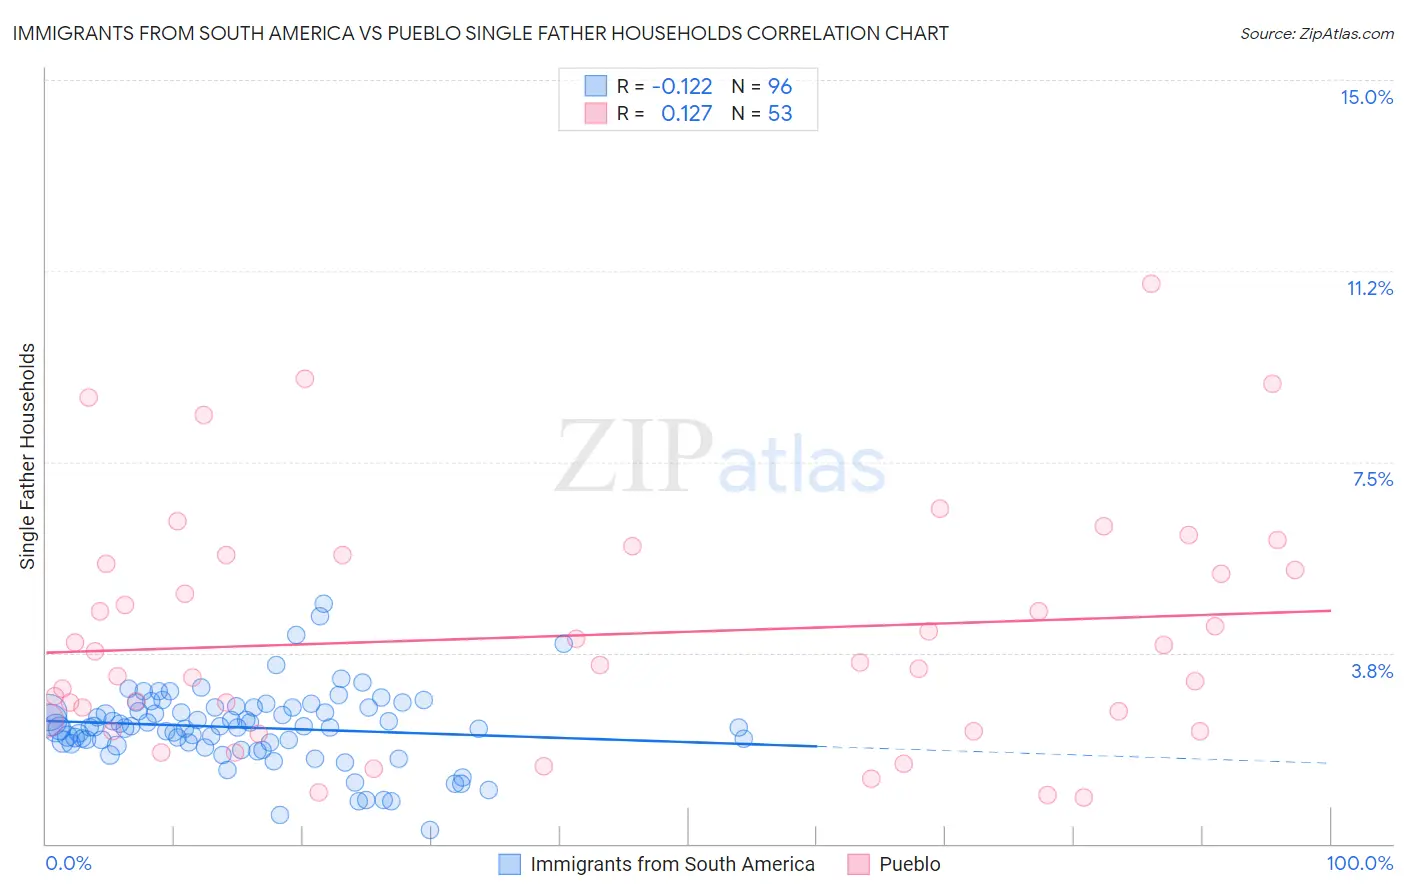
Immigrants from South America vs Pueblo Single Father Households Correlation Chart
The statistical analysis conducted on geographies consisting of 479,744,076 people shows a poor negative correlation between the proportion of Immigrants from South America and percentage of single father households in the United States with a correlation coefficient (R) of -0.122 and weighted average of 2.3%. Similarly, the statistical analysis conducted on geographies consisting of 119,775,080 people shows a poor positive correlation between the proportion of Pueblo and percentage of single father households in the United States with a correlation coefficient (R) of 0.127 and weighted average of 3.3%, a difference of 45.0%.
Single Father Households Correlation Summary
| Measurement | Immigrants from South America | Pueblo |
| Minimum | 0.26% | 0.92% |
| Maximum | 4.7% | 11.0% |
| Range | 4.5% | 10.1% |
| Mean | 2.3% | 4.1% |
| Median | 2.3% | 3.6% |
| Interquartile 25% (IQ1) | 2.0% | 2.3% |
| Interquartile 75% (IQ3) | 2.7% | 5.6% |
| Interquartile Range (IQR) | 0.71% | 3.3% |
| Standard Deviation (Sample) | 0.75% | 2.3% |
| Standard Deviation (Population) | 0.74% | 2.3% |
Similar Demographics by Single Father Households
Demographics Similar to Immigrants from South America by Single Father Households
In terms of single father households, the demographic groups most similar to Immigrants from South America are Canadian (2.3%, a difference of 0.020%), Immigrants from Senegal (2.3%, a difference of 0.050%), European (2.3%, a difference of 0.12%), Bolivian (2.3%, a difference of 0.14%), and Immigrants from West Indies (2.3%, a difference of 0.22%).
| Demographics | Rating | Rank | Single Father Households |
| Senegalese | 88.4 /100 | #149 | Excellent 2.3% |
| Venezuelans | 86.2 /100 | #150 | Excellent 2.3% |
| Immigrants | Syria | 84.8 /100 | #151 | Excellent 2.3% |
| Immigrants | Venezuela | 83.2 /100 | #152 | Excellent 2.3% |
| Immigrants | Germany | 82.8 /100 | #153 | Excellent 2.3% |
| Bolivians | 81.0 /100 | #154 | Excellent 2.3% |
| Europeans | 80.9 /100 | #155 | Excellent 2.3% |
| Immigrants | South America | 79.9 /100 | #156 | Good 2.3% |
| Canadians | 79.7 /100 | #157 | Good 2.3% |
| Immigrants | Senegal | 79.4 /100 | #158 | Good 2.3% |
| Immigrants | West Indies | 77.9 /100 | #159 | Good 2.3% |
| Immigrants | Bolivia | 76.3 /100 | #160 | Good 2.3% |
| Swiss | 73.2 /100 | #161 | Good 2.3% |
| Scottish | 72.8 /100 | #162 | Good 2.3% |
| Irish | 72.1 /100 | #163 | Good 2.3% |
Demographics Similar to Pueblo by Single Father Households
In terms of single father households, the demographic groups most similar to Pueblo are Paiute (3.3%, a difference of 0.26%), Colville (3.3%, a difference of 0.28%), Yuman (3.3%, a difference of 0.30%), Sioux (3.3%, a difference of 0.68%), and Alaskan Athabascan (3.4%, a difference of 2.1%).
| Demographics | Rating | Rank | Single Father Households |
| Nepalese | 0.0 /100 | #330 | Tragic 3.1% |
| Navajo | 0.0 /100 | #331 | Tragic 3.2% |
| Yaqui | 0.0 /100 | #332 | Tragic 3.2% |
| Natives/Alaskans | 0.0 /100 | #333 | Tragic 3.2% |
| Yuman | 0.0 /100 | #334 | Tragic 3.3% |
| Colville | 0.0 /100 | #335 | Tragic 3.3% |
| Paiute | 0.0 /100 | #336 | Tragic 3.3% |
| Pueblo | 0.0 /100 | #337 | Tragic 3.3% |
| Sioux | 0.0 /100 | #338 | Tragic 3.3% |
| Alaskan Athabascans | 0.0 /100 | #339 | Tragic 3.4% |
| Alaska Natives | 0.0 /100 | #340 | Tragic 3.5% |
| Crow | 0.0 /100 | #341 | Tragic 3.5% |
| Tohono O'odham | 0.0 /100 | #342 | Tragic 3.8% |
| Pima | 0.0 /100 | #343 | Tragic 4.2% |
| Yakama | 0.0 /100 | #344 | Tragic 4.2% |