Immigrants from South Africa vs Polish Births to Unmarried Women
COMPARE
Immigrants from South Africa
Polish
Births to Unmarried Women
Births to Unmarried Women Comparison
Immigrants from South Africa
Poles
29.3%
BIRTHS TO UNMARRIED WOMEN
95.7/ 100
METRIC RATING
97th/ 347
METRIC RANK
30.8%
BIRTHS TO UNMARRIED WOMEN
76.2/ 100
METRIC RATING
152nd/ 347
METRIC RANK
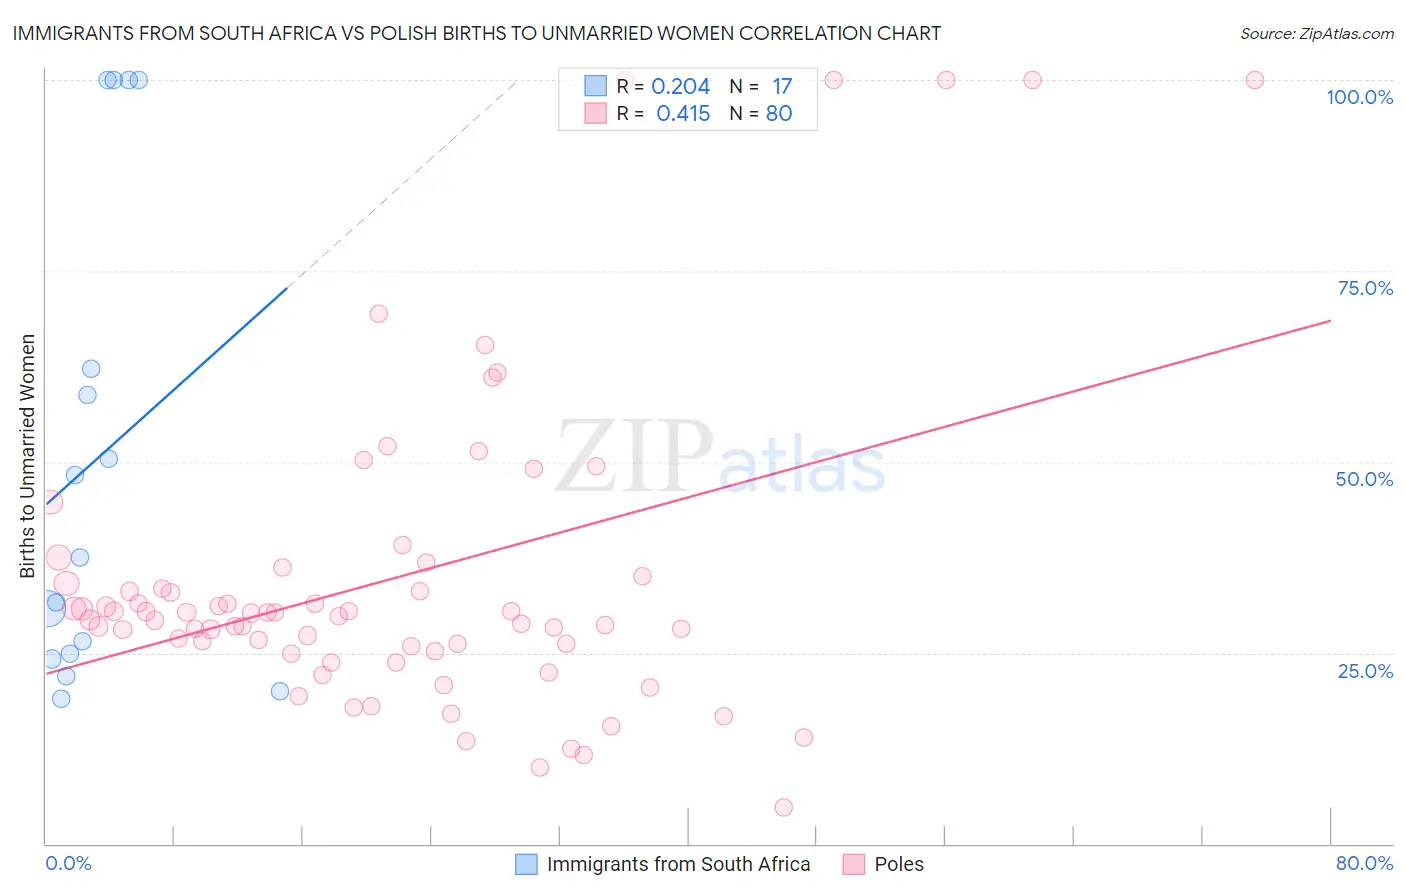
Immigrants from South Africa vs Polish Births to Unmarried Women Correlation Chart
The statistical analysis conducted on geographies consisting of 219,322,992 people shows a weak positive correlation between the proportion of Immigrants from South Africa and percentage of births to unmarried women in the United States with a correlation coefficient (R) of 0.204 and weighted average of 29.3%. Similarly, the statistical analysis conducted on geographies consisting of 497,645,952 people shows a moderate positive correlation between the proportion of Poles and percentage of births to unmarried women in the United States with a correlation coefficient (R) of 0.415 and weighted average of 30.8%, a difference of 4.9%.
Births to Unmarried Women Correlation Summary
| Measurement | Immigrants from South Africa | Polish |
| Minimum | 19.0% | 4.8% |
| Maximum | 100.0% | 100.0% |
| Range | 81.0% | 95.2% |
| Mean | 50.4% | 34.7% |
| Median | 37.5% | 30.0% |
| Interquartile 25% (IQ1) | 24.5% | 25.6% |
| Interquartile 75% (IQ3) | 81.1% | 34.5% |
| Interquartile Range (IQR) | 56.6% | 9.0% |
| Standard Deviation (Sample) | 31.2% | 20.7% |
| Standard Deviation (Population) | 30.3% | 20.6% |
Similar Demographics by Births to Unmarried Women
Demographics Similar to Immigrants from South Africa by Births to Unmarried Women
In terms of births to unmarried women, the demographic groups most similar to Immigrants from South Africa are Immigrants from Syria (29.4%, a difference of 0.020%), Norwegian (29.3%, a difference of 0.040%), Immigrants from Denmark (29.4%, a difference of 0.26%), Luxembourger (29.4%, a difference of 0.26%), and Immigrants from Vietnam (29.3%, a difference of 0.27%).
| Demographics | Rating | Rank | Births to Unmarried Women |
| Immigrants | Latvia | 96.8 /100 | #90 | Exceptional 29.1% |
| Immigrants | Fiji | 96.6 /100 | #91 | Exceptional 29.2% |
| Arabs | 96.5 /100 | #92 | Exceptional 29.2% |
| Estonians | 96.5 /100 | #93 | Exceptional 29.2% |
| Ukrainians | 96.3 /100 | #94 | Exceptional 29.2% |
| Immigrants | Vietnam | 96.1 /100 | #95 | Exceptional 29.3% |
| Norwegians | 95.8 /100 | #96 | Exceptional 29.3% |
| Immigrants | South Africa | 95.7 /100 | #97 | Exceptional 29.3% |
| Immigrants | Syria | 95.7 /100 | #98 | Exceptional 29.4% |
| Immigrants | Denmark | 95.3 /100 | #99 | Exceptional 29.4% |
| Luxembourgers | 95.2 /100 | #100 | Exceptional 29.4% |
| Immigrants | Northern Africa | 94.7 /100 | #101 | Exceptional 29.5% |
| Australians | 94.6 /100 | #102 | Exceptional 29.5% |
| Lebanese | 94.4 /100 | #103 | Exceptional 29.5% |
| Lithuanians | 94.4 /100 | #104 | Exceptional 29.6% |
Demographics Similar to Poles by Births to Unmarried Women
In terms of births to unmarried women, the demographic groups most similar to Poles are British (30.8%, a difference of 0.020%), Italian (30.8%, a difference of 0.11%), Yugoslavian (30.8%, a difference of 0.14%), Somali (30.7%, a difference of 0.22%), and Immigrants from Bangladesh (30.9%, a difference of 0.29%).
| Demographics | Rating | Rank | Births to Unmarried Women |
| Immigrants | North America | 81.5 /100 | #145 | Excellent 30.6% |
| Northern Europeans | 81.4 /100 | #146 | Excellent 30.6% |
| Immigrants | Oceania | 81.2 /100 | #147 | Excellent 30.6% |
| Chileans | 79.1 /100 | #148 | Good 30.7% |
| Serbians | 78.8 /100 | #149 | Good 30.7% |
| Somalis | 77.8 /100 | #150 | Good 30.7% |
| Italians | 77.0 /100 | #151 | Good 30.8% |
| Poles | 76.2 /100 | #152 | Good 30.8% |
| British | 76.0 /100 | #153 | Good 30.8% |
| Yugoslavians | 75.1 /100 | #154 | Good 30.8% |
| Immigrants | Bangladesh | 73.9 /100 | #155 | Good 30.9% |
| Carpatho Rusyns | 73.5 /100 | #156 | Good 30.9% |
| Immigrants | Eastern Africa | 72.1 /100 | #157 | Good 31.0% |
| Austrians | 69.9 /100 | #158 | Good 31.0% |
| Immigrants | England | 69.4 /100 | #159 | Good 31.1% |