Immigrants from South Africa vs Kenyan Married-couple Households
COMPARE
Immigrants from South Africa
Kenyan
Married-couple Households
Married-couple Households Comparison
Immigrants from South Africa
Kenyans
47.8%
MARRIED-COUPLE HOUSEHOLDS
96.0/ 100
METRIC RATING
104th/ 347
METRIC RANK
44.7%
MARRIED-COUPLE HOUSEHOLDS
1.7/ 100
METRIC RATING
228th/ 347
METRIC RANK
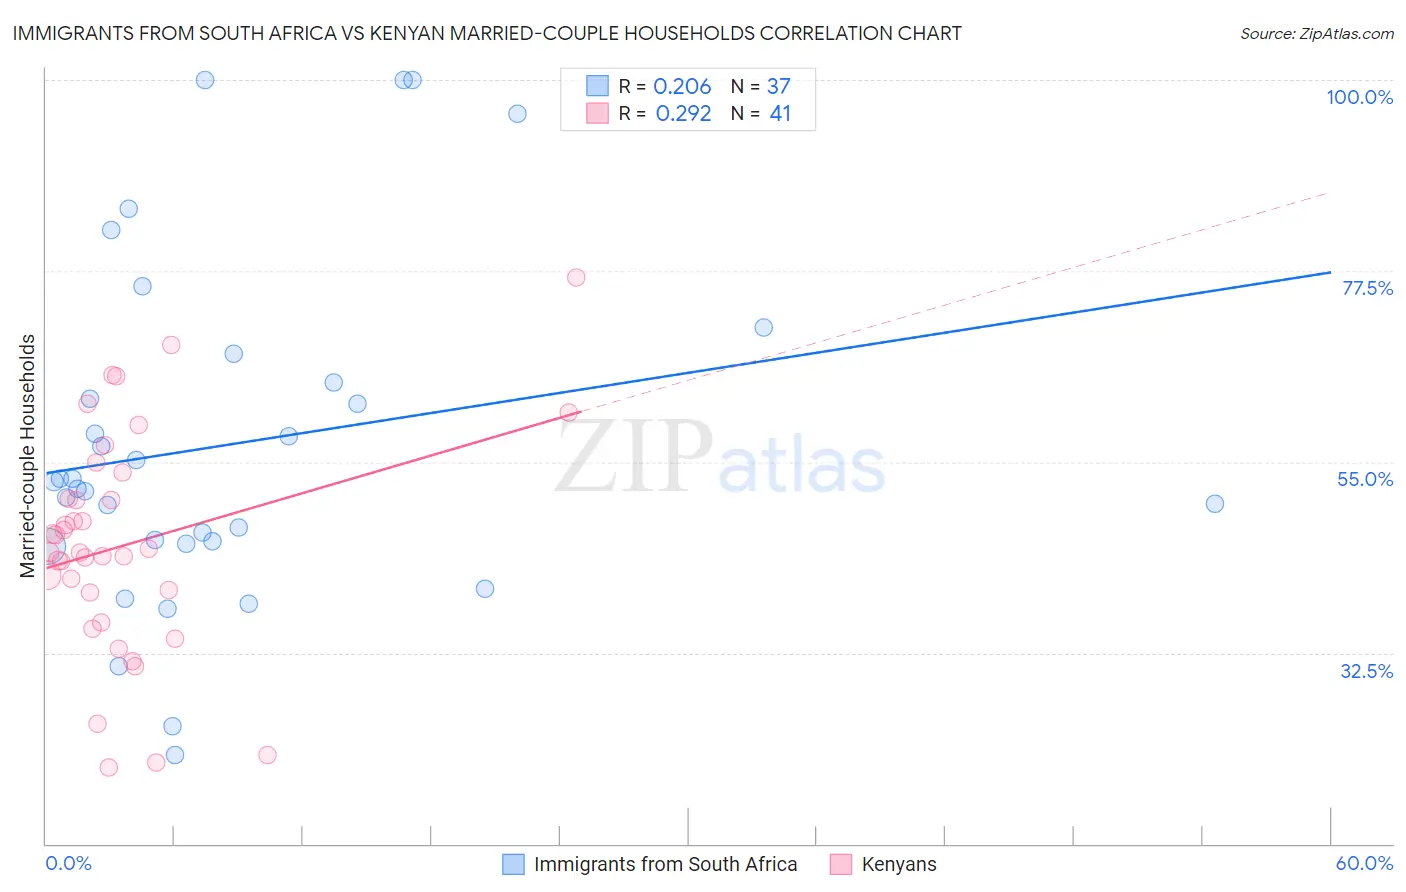
Immigrants from South Africa vs Kenyan Married-couple Households Correlation Chart
The statistical analysis conducted on geographies consisting of 233,270,946 people shows a weak positive correlation between the proportion of Immigrants from South Africa and percentage of married-couple family households in the United States with a correlation coefficient (R) of 0.206 and weighted average of 47.8%. Similarly, the statistical analysis conducted on geographies consisting of 168,165,214 people shows a weak positive correlation between the proportion of Kenyans and percentage of married-couple family households in the United States with a correlation coefficient (R) of 0.292 and weighted average of 44.7%, a difference of 7.1%.
Married-couple Households Correlation Summary
| Measurement | Immigrants from South Africa | Kenyan |
| Minimum | 20.5% | 18.9% |
| Maximum | 100.0% | 76.7% |
| Range | 79.5% | 57.7% |
| Mean | 57.1% | 45.3% |
| Median | 52.7% | 44.4% |
| Interquartile 25% (IQ1) | 45.5% | 37.8% |
| Interquartile 75% (IQ3) | 66.0% | 52.2% |
| Interquartile Range (IQR) | 20.6% | 14.4% |
| Standard Deviation (Sample) | 20.2% | 13.1% |
| Standard Deviation (Population) | 19.9% | 12.9% |
Similar Demographics by Married-couple Households
Demographics Similar to Immigrants from South Africa by Married-couple Households
In terms of married-couple households, the demographic groups most similar to Immigrants from South Africa are Slavic (47.8%, a difference of 0.010%), Hawaiian (47.8%, a difference of 0.010%), Turkish (47.8%, a difference of 0.030%), Immigrants from Italy (47.9%, a difference of 0.090%), and Immigrants from Austria (47.9%, a difference of 0.10%).
| Demographics | Rating | Rank | Married-couple Households |
| Latvians | 96.5 /100 | #97 | Exceptional 47.9% |
| Immigrants | North Macedonia | 96.4 /100 | #98 | Exceptional 47.9% |
| Immigrants | Austria | 96.4 /100 | #99 | Exceptional 47.9% |
| Immigrants | Italy | 96.3 /100 | #100 | Exceptional 47.9% |
| Turks | 96.1 /100 | #101 | Exceptional 47.8% |
| Slavs | 96.0 /100 | #102 | Exceptional 47.8% |
| Hawaiians | 96.0 /100 | #103 | Exceptional 47.8% |
| Immigrants | South Africa | 96.0 /100 | #104 | Exceptional 47.8% |
| Immigrants | Czechoslovakia | 95.5 /100 | #105 | Exceptional 47.8% |
| Portuguese | 95.5 /100 | #106 | Exceptional 47.8% |
| Estonians | 94.7 /100 | #107 | Exceptional 47.7% |
| Immigrants | Japan | 94.4 /100 | #108 | Exceptional 47.7% |
| Immigrants | Jordan | 94.1 /100 | #109 | Exceptional 47.7% |
| Macedonians | 93.9 /100 | #110 | Exceptional 47.6% |
| Syrians | 93.9 /100 | #111 | Exceptional 47.6% |
Demographics Similar to Kenyans by Married-couple Households
In terms of married-couple households, the demographic groups most similar to Kenyans are Immigrants from Latin America (44.7%, a difference of 0.050%), Soviet Union (44.6%, a difference of 0.090%), Houma (44.6%, a difference of 0.10%), Marshallese (44.6%, a difference of 0.10%), and Salvadoran (44.7%, a difference of 0.13%).
| Demographics | Rating | Rank | Married-couple Households |
| Tlingit-Haida | 4.9 /100 | #221 | Tragic 45.1% |
| Immigrants | Laos | 4.6 /100 | #222 | Tragic 45.1% |
| Immigrants | Cambodia | 2.7 /100 | #223 | Tragic 44.9% |
| Immigrants | Micronesia | 2.6 /100 | #224 | Tragic 44.9% |
| Dutch West Indians | 2.6 /100 | #225 | Tragic 44.9% |
| Alsatians | 2.3 /100 | #226 | Tragic 44.8% |
| Salvadorans | 1.9 /100 | #227 | Tragic 44.7% |
| Kenyans | 1.7 /100 | #228 | Tragic 44.7% |
| Immigrants | Latin America | 1.6 /100 | #229 | Tragic 44.7% |
| Soviet Union | 1.6 /100 | #230 | Tragic 44.6% |
| Houma | 1.5 /100 | #231 | Tragic 44.6% |
| Marshallese | 1.5 /100 | #232 | Tragic 44.6% |
| Immigrants | Uganda | 1.5 /100 | #233 | Tragic 44.6% |
| Immigrants | Panama | 1.3 /100 | #234 | Tragic 44.6% |
| Immigrants | Nicaragua | 1.2 /100 | #235 | Tragic 44.5% |