Immigrants from South Africa vs Kenyan Master's Degree
COMPARE
Immigrants from South Africa
Kenyan
Master's Degree
Master's Degree Comparison
Immigrants from South Africa
Kenyans
18.8%
MASTER'S DEGREE
100.0/ 100
METRIC RATING
51st/ 347
METRIC RANK
15.3%
MASTER'S DEGREE
70.3/ 100
METRIC RATING
160th/ 347
METRIC RANK
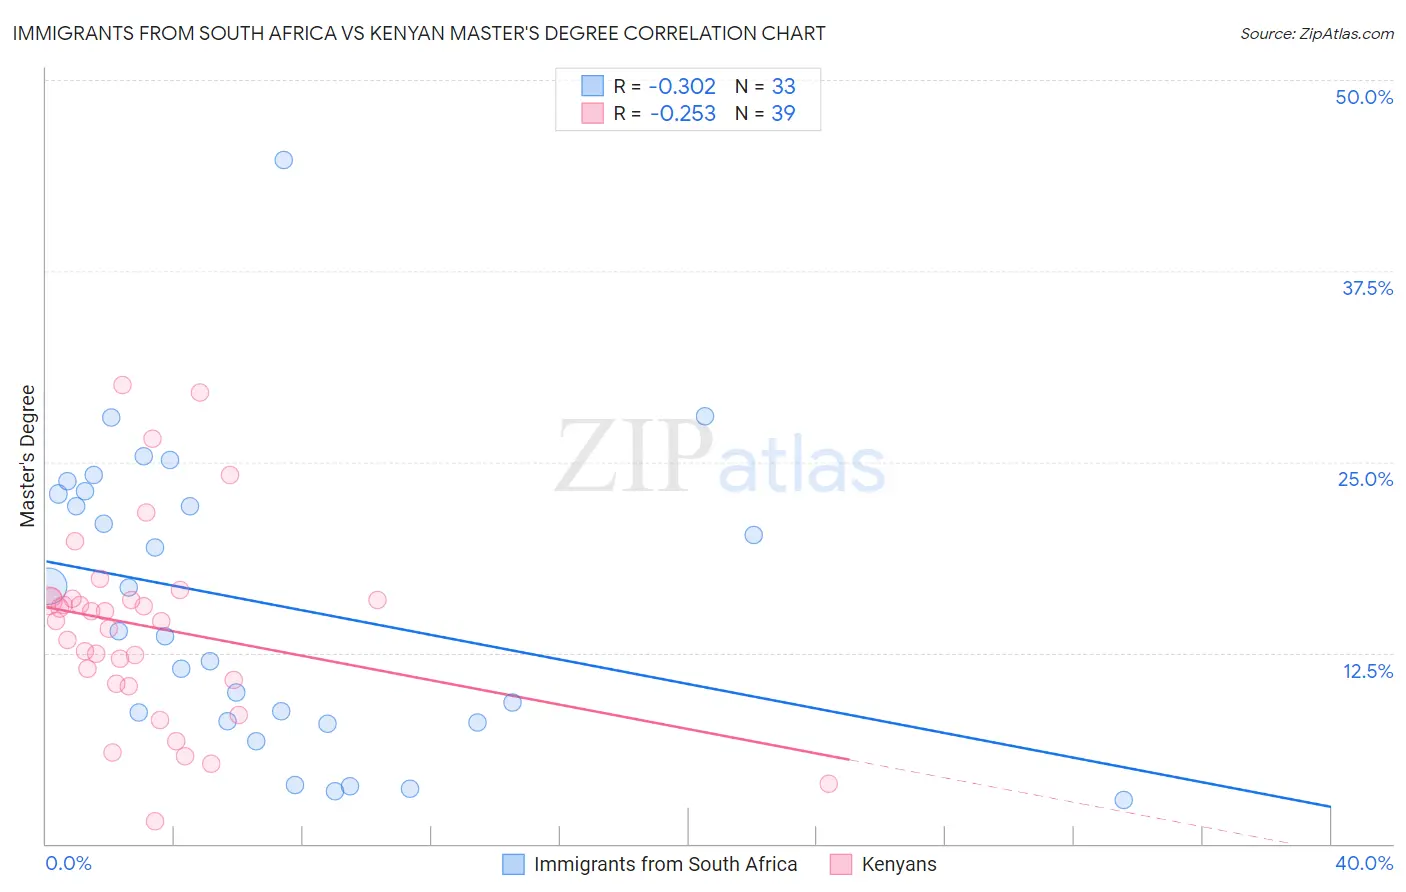
Immigrants from South Africa vs Kenyan Master's Degree Correlation Chart
The statistical analysis conducted on geographies consisting of 233,295,718 people shows a mild negative correlation between the proportion of Immigrants from South Africa and percentage of population with at least master's degree education in the United States with a correlation coefficient (R) of -0.302 and weighted average of 18.8%. Similarly, the statistical analysis conducted on geographies consisting of 168,212,419 people shows a weak negative correlation between the proportion of Kenyans and percentage of population with at least master's degree education in the United States with a correlation coefficient (R) of -0.253 and weighted average of 15.3%, a difference of 22.3%.
Master's Degree Correlation Summary
| Measurement | Immigrants from South Africa | Kenyan |
| Minimum | 2.9% | 1.5% |
| Maximum | 44.8% | 30.0% |
| Range | 41.9% | 28.5% |
| Mean | 15.7% | 14.2% |
| Median | 13.9% | 14.6% |
| Interquartile 25% (IQ1) | 8.0% | 10.5% |
| Interquartile 75% (IQ3) | 23.0% | 16.0% |
| Interquartile Range (IQR) | 15.0% | 5.6% |
| Standard Deviation (Sample) | 9.6% | 6.4% |
| Standard Deviation (Population) | 9.4% | 6.3% |
Similar Demographics by Master's Degree
Demographics Similar to Immigrants from South Africa by Master's Degree
In terms of master's degree, the demographic groups most similar to Immigrants from South Africa are Bulgarian (18.8%, a difference of 0.010%), Estonian (18.8%, a difference of 0.20%), Paraguayan (18.8%, a difference of 0.30%), Immigrants from Austria (18.8%, a difference of 0.35%), and Immigrants from Norway (18.8%, a difference of 0.37%).
| Demographics | Rating | Rank | Master's Degree |
| Immigrants | Malaysia | 100.0 /100 | #44 | Exceptional 18.9% |
| Immigrants | Belarus | 100.0 /100 | #45 | Exceptional 18.9% |
| Immigrants | Norway | 100.0 /100 | #46 | Exceptional 18.8% |
| Immigrants | Austria | 100.0 /100 | #47 | Exceptional 18.8% |
| Paraguayans | 100.0 /100 | #48 | Exceptional 18.8% |
| Estonians | 100.0 /100 | #49 | Exceptional 18.8% |
| Bulgarians | 100.0 /100 | #50 | Exceptional 18.8% |
| Immigrants | South Africa | 100.0 /100 | #51 | Exceptional 18.8% |
| Immigrants | Kuwait | 100.0 /100 | #52 | Exceptional 18.6% |
| Immigrants | Czechoslovakia | 99.9 /100 | #53 | Exceptional 18.5% |
| Immigrants | Lithuania | 99.9 /100 | #54 | Exceptional 18.5% |
| Immigrants | Serbia | 99.9 /100 | #55 | Exceptional 18.5% |
| Asians | 99.9 /100 | #56 | Exceptional 18.4% |
| Immigrants | Asia | 99.9 /100 | #57 | Exceptional 18.4% |
| Australians | 99.9 /100 | #58 | Exceptional 18.4% |
Demographics Similar to Kenyans by Master's Degree
In terms of master's degree, the demographic groups most similar to Kenyans are Luxembourger (15.3%, a difference of 0.11%), Immigrants from Poland (15.4%, a difference of 0.18%), Immigrants from Cameroon (15.4%, a difference of 0.22%), Sudanese (15.3%, a difference of 0.23%), and Peruvian (15.3%, a difference of 0.24%).
| Demographics | Rating | Rank | Master's Degree |
| Icelanders | 76.8 /100 | #153 | Good 15.5% |
| Immigrants | South America | 76.3 /100 | #154 | Good 15.5% |
| Immigrants | Bangladesh | 76.1 /100 | #155 | Good 15.5% |
| Bermudans | 73.9 /100 | #156 | Good 15.4% |
| Immigrants | Cameroon | 71.7 /100 | #157 | Good 15.4% |
| Immigrants | Poland | 71.5 /100 | #158 | Good 15.4% |
| Luxembourgers | 71.0 /100 | #159 | Good 15.3% |
| Kenyans | 70.3 /100 | #160 | Good 15.3% |
| Sudanese | 68.7 /100 | #161 | Good 15.3% |
| Peruvians | 68.7 /100 | #162 | Good 15.3% |
| Uruguayans | 67.1 /100 | #163 | Good 15.3% |
| Colombians | 66.9 /100 | #164 | Good 15.3% |
| Immigrants | Kenya | 66.6 /100 | #165 | Good 15.3% |
| Swedes | 66.1 /100 | #166 | Good 15.2% |
| Senegalese | 65.6 /100 | #167 | Good 15.2% |