Immigrants from South Africa vs Immigrants from Cameroon Married-couple Households
COMPARE
Immigrants from South Africa
Immigrants from Cameroon
Married-couple Households
Married-couple Households Comparison
Immigrants from South Africa
Immigrants from Cameroon
47.8%
MARRIED-COUPLE HOUSEHOLDS
96.0/ 100
METRIC RATING
104th/ 347
METRIC RANK
43.7%
MARRIED-COUPLE HOUSEHOLDS
0.2/ 100
METRIC RATING
260th/ 347
METRIC RANK
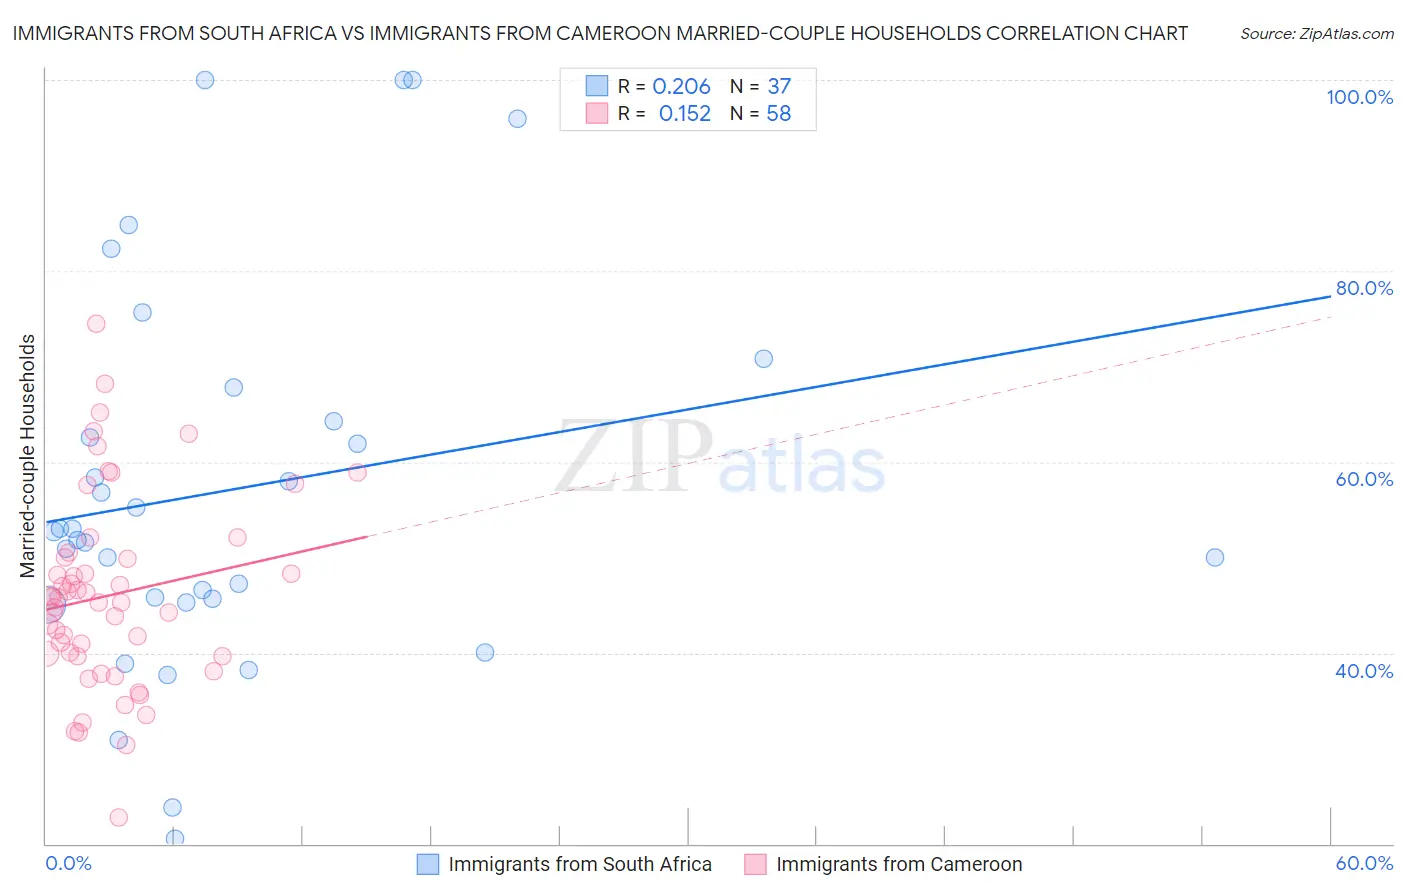
Immigrants from South Africa vs Immigrants from Cameroon Married-couple Households Correlation Chart
The statistical analysis conducted on geographies consisting of 233,270,946 people shows a weak positive correlation between the proportion of Immigrants from South Africa and percentage of married-couple family households in the United States with a correlation coefficient (R) of 0.206 and weighted average of 47.8%. Similarly, the statistical analysis conducted on geographies consisting of 130,731,618 people shows a poor positive correlation between the proportion of Immigrants from Cameroon and percentage of married-couple family households in the United States with a correlation coefficient (R) of 0.152 and weighted average of 43.7%, a difference of 9.4%.
Married-couple Households Correlation Summary
| Measurement | Immigrants from South Africa | Immigrants from Cameroon |
| Minimum | 20.5% | 22.8% |
| Maximum | 100.0% | 74.5% |
| Range | 79.5% | 51.8% |
| Mean | 57.1% | 46.0% |
| Median | 52.7% | 45.5% |
| Interquartile 25% (IQ1) | 45.5% | 39.6% |
| Interquartile 75% (IQ3) | 66.0% | 50.0% |
| Interquartile Range (IQR) | 20.6% | 10.4% |
| Standard Deviation (Sample) | 20.2% | 10.1% |
| Standard Deviation (Population) | 19.9% | 10.0% |
Similar Demographics by Married-couple Households
Demographics Similar to Immigrants from South Africa by Married-couple Households
In terms of married-couple households, the demographic groups most similar to Immigrants from South Africa are Slavic (47.8%, a difference of 0.010%), Hawaiian (47.8%, a difference of 0.010%), Turkish (47.8%, a difference of 0.030%), Immigrants from Italy (47.9%, a difference of 0.090%), and Immigrants from Austria (47.9%, a difference of 0.10%).
| Demographics | Rating | Rank | Married-couple Households |
| Latvians | 96.5 /100 | #97 | Exceptional 47.9% |
| Immigrants | North Macedonia | 96.4 /100 | #98 | Exceptional 47.9% |
| Immigrants | Austria | 96.4 /100 | #99 | Exceptional 47.9% |
| Immigrants | Italy | 96.3 /100 | #100 | Exceptional 47.9% |
| Turks | 96.1 /100 | #101 | Exceptional 47.8% |
| Slavs | 96.0 /100 | #102 | Exceptional 47.8% |
| Hawaiians | 96.0 /100 | #103 | Exceptional 47.8% |
| Immigrants | South Africa | 96.0 /100 | #104 | Exceptional 47.8% |
| Immigrants | Czechoslovakia | 95.5 /100 | #105 | Exceptional 47.8% |
| Portuguese | 95.5 /100 | #106 | Exceptional 47.8% |
| Estonians | 94.7 /100 | #107 | Exceptional 47.7% |
| Immigrants | Japan | 94.4 /100 | #108 | Exceptional 47.7% |
| Immigrants | Jordan | 94.1 /100 | #109 | Exceptional 47.7% |
| Macedonians | 93.9 /100 | #110 | Exceptional 47.6% |
| Syrians | 93.9 /100 | #111 | Exceptional 47.6% |
Demographics Similar to Immigrants from Cameroon by Married-couple Households
In terms of married-couple households, the demographic groups most similar to Immigrants from Cameroon are Iroquois (43.7%, a difference of 0.090%), Central American Indian (43.8%, a difference of 0.12%), Alaskan Athabascan (43.6%, a difference of 0.13%), Blackfeet (43.8%, a difference of 0.15%), and Vietnamese (43.6%, a difference of 0.19%).
| Demographics | Rating | Rank | Married-couple Households |
| Central Americans | 0.3 /100 | #253 | Tragic 43.9% |
| Apache | 0.3 /100 | #254 | Tragic 43.9% |
| Shoshone | 0.3 /100 | #255 | Tragic 43.9% |
| Ugandans | 0.3 /100 | #256 | Tragic 43.8% |
| Blackfeet | 0.2 /100 | #257 | Tragic 43.8% |
| Central American Indians | 0.2 /100 | #258 | Tragic 43.8% |
| Iroquois | 0.2 /100 | #259 | Tragic 43.7% |
| Immigrants | Cameroon | 0.2 /100 | #260 | Tragic 43.7% |
| Alaskan Athabascans | 0.2 /100 | #261 | Tragic 43.6% |
| Vietnamese | 0.2 /100 | #262 | Tragic 43.6% |
| Cree | 0.1 /100 | #263 | Tragic 43.6% |
| Bangladeshis | 0.1 /100 | #264 | Tragic 43.5% |
| Moroccans | 0.1 /100 | #265 | Tragic 43.5% |
| Ecuadorians | 0.1 /100 | #266 | Tragic 43.5% |
| Natives/Alaskans | 0.1 /100 | #267 | Tragic 43.5% |