Immigrants from Somalia vs Dominican Single Mother Households
COMPARE
Immigrants from Somalia
Dominican
Single Mother Households
Single Mother Households Comparison
Immigrants from Somalia
Dominicans
7.4%
SINGLE MOTHER HOUSEHOLDS
0.2/ 100
METRIC RATING
262nd/ 347
METRIC RANK
9.2%
SINGLE MOTHER HOUSEHOLDS
0.0/ 100
METRIC RATING
343rd/ 347
METRIC RANK
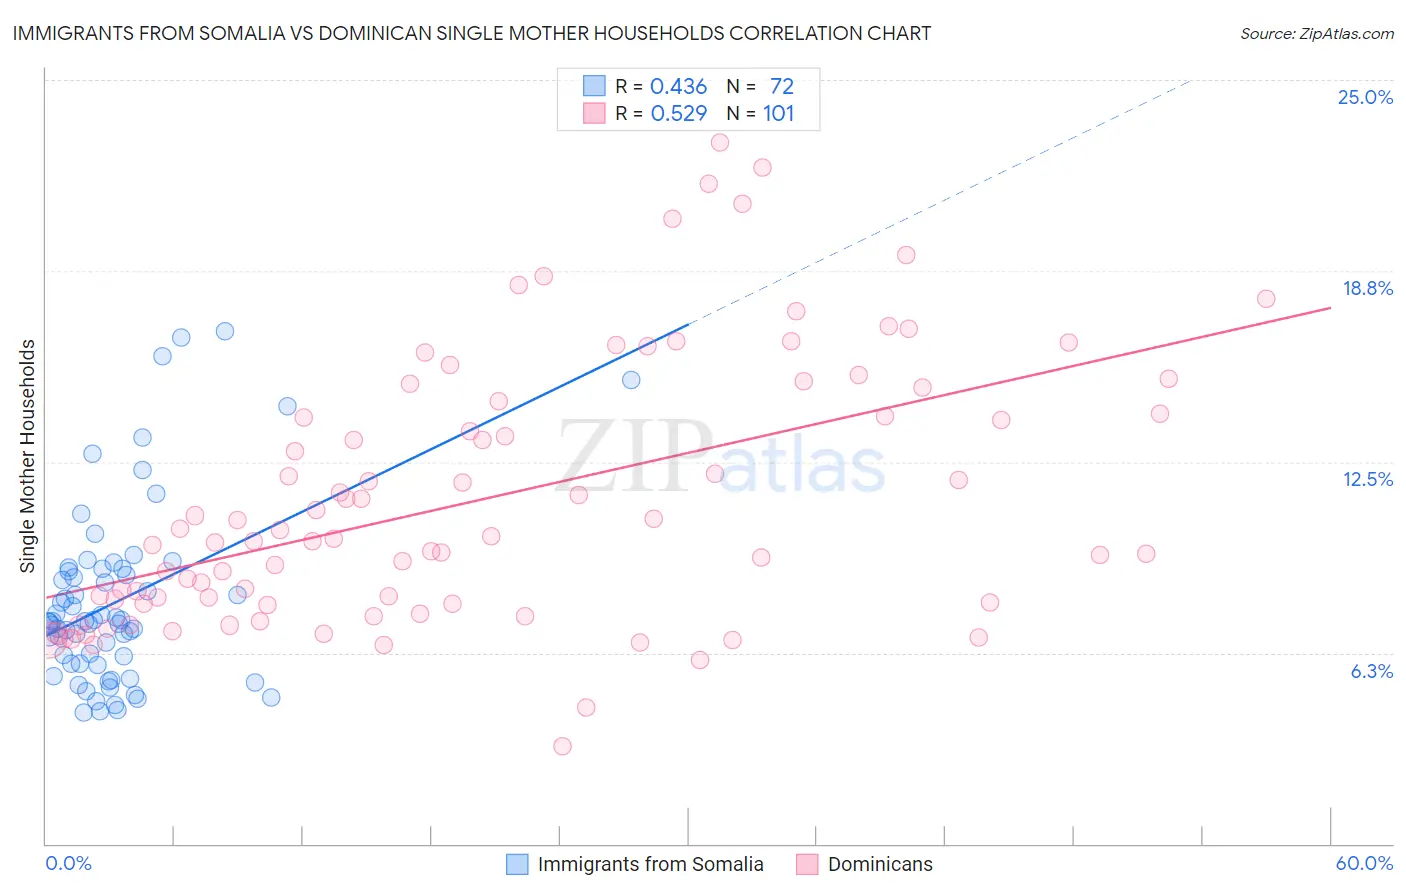
Immigrants from Somalia vs Dominican Single Mother Households Correlation Chart
The statistical analysis conducted on geographies consisting of 92,083,872 people shows a moderate positive correlation between the proportion of Immigrants from Somalia and percentage of single mother households in the United States with a correlation coefficient (R) of 0.436 and weighted average of 7.4%. Similarly, the statistical analysis conducted on geographies consisting of 354,173,305 people shows a substantial positive correlation between the proportion of Dominicans and percentage of single mother households in the United States with a correlation coefficient (R) of 0.529 and weighted average of 9.2%, a difference of 23.7%.
Single Mother Households Correlation Summary
| Measurement | Immigrants from Somalia | Dominican |
| Minimum | 4.3% | 3.2% |
| Maximum | 16.8% | 23.0% |
| Range | 12.5% | 19.8% |
| Mean | 7.9% | 11.3% |
| Median | 7.3% | 10.0% |
| Interquartile 25% (IQ1) | 5.9% | 7.9% |
| Interquartile 75% (IQ3) | 9.0% | 14.3% |
| Interquartile Range (IQR) | 3.1% | 6.4% |
| Standard Deviation (Sample) | 2.9% | 4.3% |
| Standard Deviation (Population) | 2.9% | 4.3% |
Similar Demographics by Single Mother Households
Demographics Similar to Immigrants from Somalia by Single Mother Households
In terms of single mother households, the demographic groups most similar to Immigrants from Somalia are Immigrants from Nicaragua (7.4%, a difference of 0.15%), Japanese (7.4%, a difference of 0.20%), Immigrants from Zaire (7.4%, a difference of 0.22%), Yaqui (7.4%, a difference of 0.23%), and Immigrants from Yemen (7.4%, a difference of 0.26%).
| Demographics | Rating | Rank | Single Mother Households |
| Mexican American Indians | 0.2 /100 | #255 | Tragic 7.4% |
| Seminole | 0.2 /100 | #256 | Tragic 7.4% |
| Alaska Natives | 0.2 /100 | #257 | Tragic 7.4% |
| Pueblo | 0.2 /100 | #258 | Tragic 7.4% |
| Immigrants | Yemen | 0.2 /100 | #259 | Tragic 7.4% |
| Immigrants | Zaire | 0.2 /100 | #260 | Tragic 7.4% |
| Japanese | 0.2 /100 | #261 | Tragic 7.4% |
| Immigrants | Somalia | 0.2 /100 | #262 | Tragic 7.4% |
| Immigrants | Nicaragua | 0.2 /100 | #263 | Tragic 7.4% |
| Yaqui | 0.1 /100 | #264 | Tragic 7.4% |
| Crow | 0.1 /100 | #265 | Tragic 7.4% |
| Nepalese | 0.1 /100 | #266 | Tragic 7.5% |
| Blackfeet | 0.1 /100 | #267 | Tragic 7.5% |
| Indonesians | 0.1 /100 | #268 | Tragic 7.5% |
| Somalis | 0.1 /100 | #269 | Tragic 7.5% |
Demographics Similar to Dominicans by Single Mother Households
In terms of single mother households, the demographic groups most similar to Dominicans are Menominee (9.2%, a difference of 0.21%), Tohono O'odham (9.1%, a difference of 0.53%), Lumbee (9.1%, a difference of 0.89%), Black/African American (9.0%, a difference of 2.1%), and Immigrants from Dominican Republic (9.5%, a difference of 3.5%).
| Demographics | Rating | Rank | Single Mother Households |
| Liberians | 0.0 /100 | #333 | Tragic 8.6% |
| Immigrants | Liberia | 0.0 /100 | #334 | Tragic 8.7% |
| Immigrants | Dominica | 0.0 /100 | #335 | Tragic 8.7% |
| Puerto Ricans | 0.0 /100 | #336 | Tragic 8.7% |
| Navajo | 0.0 /100 | #337 | Tragic 8.8% |
| Cape Verdeans | 0.0 /100 | #338 | Tragic 8.9% |
| Blacks/African Americans | 0.0 /100 | #339 | Tragic 9.0% |
| Lumbee | 0.0 /100 | #340 | Tragic 9.1% |
| Tohono O'odham | 0.0 /100 | #341 | Tragic 9.1% |
| Menominee | 0.0 /100 | #342 | Tragic 9.2% |
| Dominicans | 0.0 /100 | #343 | Tragic 9.2% |
| Immigrants | Dominican Republic | 0.0 /100 | #344 | Tragic 9.5% |
| Immigrants | Cabo Verde | 0.0 /100 | #345 | Tragic 9.6% |
| Yuman | 0.0 /100 | #346 | Tragic 9.6% |
| Yup'ik | 0.0 /100 | #347 | Tragic 10.0% |