Immigrants from Somalia vs Cheyenne Seniors Poverty Over the Age of 75
COMPARE
Immigrants from Somalia
Cheyenne
Seniors Poverty Over the Age of 75
Seniors Poverty Over the Age of 75 Comparison
Immigrants from Somalia
Cheyenne
13.5%
SENIORS POVERTY OVER THE AGE OF 75
0.6/ 100
METRIC RATING
242nd/ 347
METRIC RANK
14.9%
SENIORS POVERTY OVER THE AGE OF 75
0.0/ 100
METRIC RATING
284th/ 347
METRIC RANK
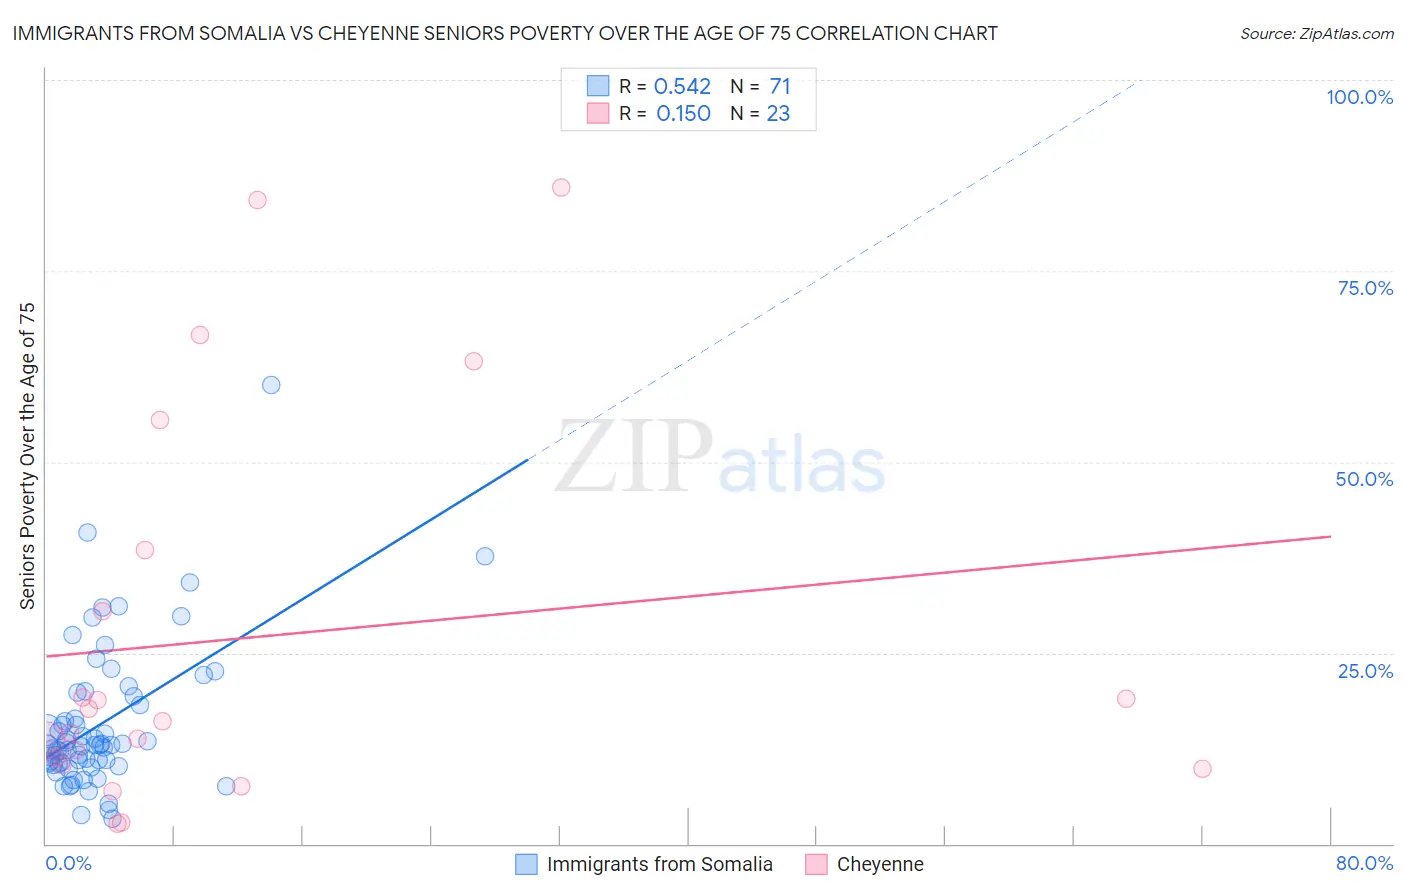
Immigrants from Somalia vs Cheyenne Seniors Poverty Over the Age of 75 Correlation Chart
The statistical analysis conducted on geographies consisting of 91,864,601 people shows a substantial positive correlation between the proportion of Immigrants from Somalia and poverty level among seniors over the age of 75 in the United States with a correlation coefficient (R) of 0.542 and weighted average of 13.5%. Similarly, the statistical analysis conducted on geographies consisting of 80,378,238 people shows a poor positive correlation between the proportion of Cheyenne and poverty level among seniors over the age of 75 in the United States with a correlation coefficient (R) of 0.150 and weighted average of 14.9%, a difference of 10.6%.
Seniors Poverty Over the Age of 75 Correlation Summary
| Measurement | Immigrants from Somalia | Cheyenne |
| Minimum | 3.2% | 2.7% |
| Maximum | 60.0% | 85.9% |
| Range | 56.8% | 83.2% |
| Mean | 15.7% | 27.0% |
| Median | 12.9% | 16.1% |
| Interquartile 25% (IQ1) | 10.5% | 10.3% |
| Interquartile 75% (IQ3) | 19.2% | 38.5% |
| Interquartile Range (IQR) | 8.8% | 28.2% |
| Standard Deviation (Sample) | 9.5% | 25.7% |
| Standard Deviation (Population) | 9.5% | 25.1% |
Similar Demographics by Seniors Poverty Over the Age of 75
Demographics Similar to Immigrants from Somalia by Seniors Poverty Over the Age of 75
In terms of seniors poverty over the age of 75, the demographic groups most similar to Immigrants from Somalia are Dutch West Indian (13.5%, a difference of 0.030%), Immigrants from Russia (13.4%, a difference of 0.10%), Argentinean (13.4%, a difference of 0.24%), Spanish American (13.5%, a difference of 0.34%), and Uruguayan (13.5%, a difference of 0.48%).
| Demographics | Rating | Rank | Seniors Poverty Over the Age of 75 |
| Japanese | 0.9 /100 | #235 | Tragic 13.3% |
| Moroccans | 0.9 /100 | #236 | Tragic 13.3% |
| Alaskan Athabascans | 0.8 /100 | #237 | Tragic 13.4% |
| Peruvians | 0.8 /100 | #238 | Tragic 13.4% |
| Panamanians | 0.8 /100 | #239 | Tragic 13.4% |
| Argentineans | 0.7 /100 | #240 | Tragic 13.4% |
| Immigrants | Russia | 0.6 /100 | #241 | Tragic 13.4% |
| Immigrants | Somalia | 0.6 /100 | #242 | Tragic 13.5% |
| Dutch West Indians | 0.6 /100 | #243 | Tragic 13.5% |
| Spanish Americans | 0.5 /100 | #244 | Tragic 13.5% |
| Uruguayans | 0.5 /100 | #245 | Tragic 13.5% |
| Immigrants | Cambodia | 0.4 /100 | #246 | Tragic 13.6% |
| Immigrants | Ukraine | 0.3 /100 | #247 | Tragic 13.6% |
| Africans | 0.3 /100 | #248 | Tragic 13.6% |
| Immigrants | Albania | 0.3 /100 | #249 | Tragic 13.6% |
Demographics Similar to Cheyenne by Seniors Poverty Over the Age of 75
In terms of seniors poverty over the age of 75, the demographic groups most similar to Cheyenne are Immigrants from Mexico (14.9%, a difference of 0.19%), Immigrants from Central America (15.0%, a difference of 0.53%), Guatemalan (14.8%, a difference of 0.64%), Immigrants from Senegal (14.8%, a difference of 0.70%), and Belizean (14.8%, a difference of 0.88%).
| Demographics | Rating | Rank | Seniors Poverty Over the Age of 75 |
| Senegalese | 0.0 /100 | #277 | Tragic 14.5% |
| Immigrants | Colombia | 0.0 /100 | #278 | Tragic 14.6% |
| Blacks/African Americans | 0.0 /100 | #279 | Tragic 14.6% |
| Central Americans | 0.0 /100 | #280 | Tragic 14.7% |
| Belizeans | 0.0 /100 | #281 | Tragic 14.8% |
| Immigrants | Senegal | 0.0 /100 | #282 | Tragic 14.8% |
| Guatemalans | 0.0 /100 | #283 | Tragic 14.8% |
| Cheyenne | 0.0 /100 | #284 | Tragic 14.9% |
| Immigrants | Mexico | 0.0 /100 | #285 | Tragic 14.9% |
| Immigrants | Central America | 0.0 /100 | #286 | Tragic 15.0% |
| Immigrants | Guatemala | 0.0 /100 | #287 | Tragic 15.1% |
| Jamaicans | 0.0 /100 | #288 | Tragic 15.1% |
| Immigrants | Belize | 0.0 /100 | #289 | Tragic 15.2% |
| Immigrants | Azores | 0.0 /100 | #290 | Tragic 15.2% |
| Paiute | 0.0 /100 | #291 | Tragic 15.2% |