Immigrants from Serbia vs Immigrants from Switzerland Single Mother Households
COMPARE
Immigrants from Serbia
Immigrants from Switzerland
Single Mother Households
Single Mother Households Comparison
Immigrants from Serbia
Immigrants from Switzerland
5.4%
SINGLE MOTHER HOUSEHOLDS
99.6/ 100
METRIC RATING
38th/ 347
METRIC RANK
5.3%
SINGLE MOTHER HOUSEHOLDS
99.7/ 100
METRIC RATING
33rd/ 347
METRIC RANK
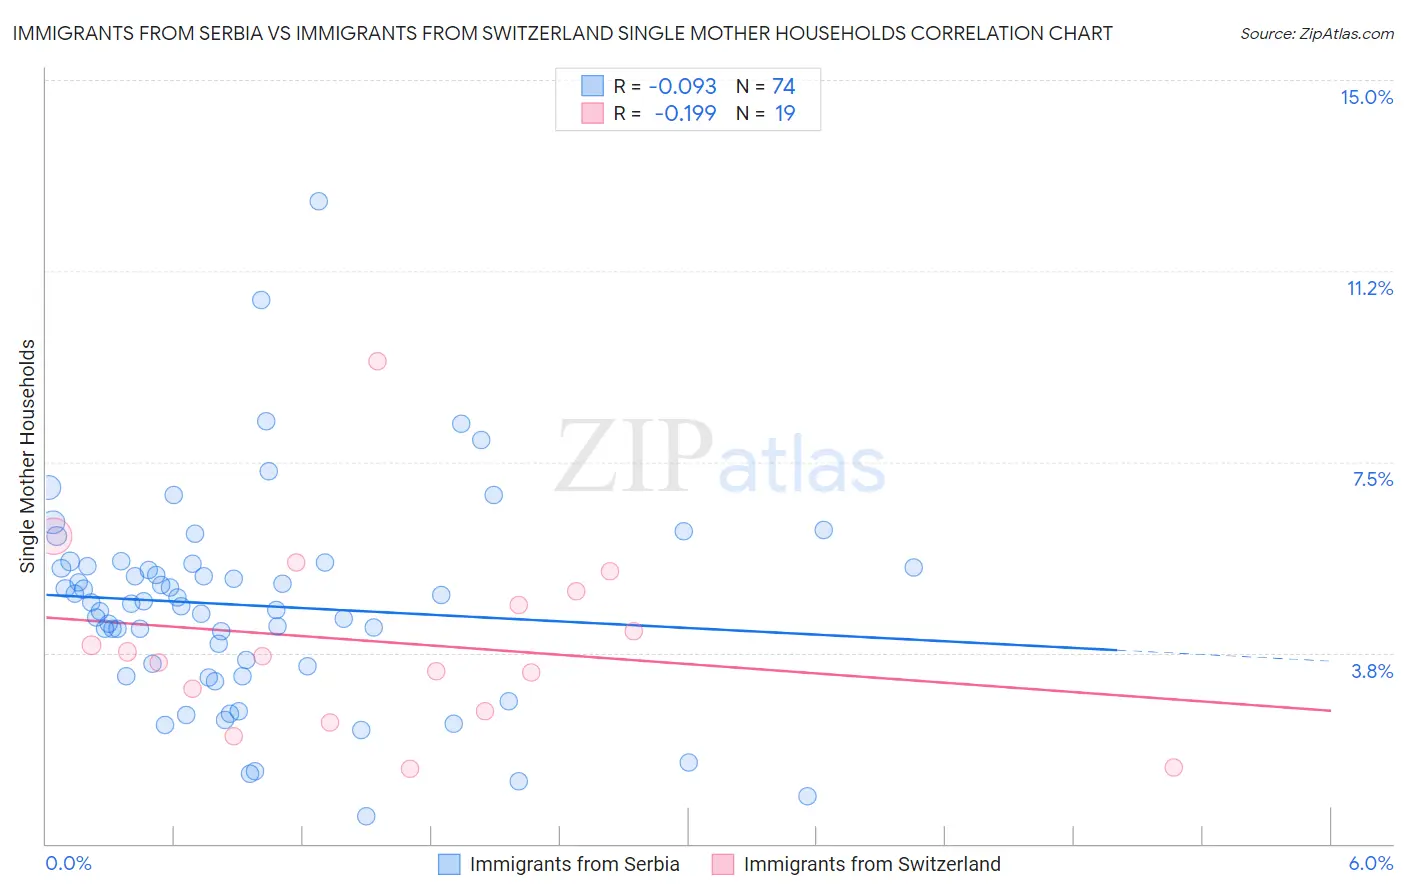
Immigrants from Serbia vs Immigrants from Switzerland Single Mother Households Correlation Chart
The statistical analysis conducted on geographies consisting of 131,621,048 people shows a slight negative correlation between the proportion of Immigrants from Serbia and percentage of single mother households in the United States with a correlation coefficient (R) of -0.093 and weighted average of 5.4%. Similarly, the statistical analysis conducted on geographies consisting of 147,838,806 people shows a poor negative correlation between the proportion of Immigrants from Switzerland and percentage of single mother households in the United States with a correlation coefficient (R) of -0.199 and weighted average of 5.3%, a difference of 0.84%.
Single Mother Households Correlation Summary
| Measurement | Immigrants from Serbia | Immigrants from Switzerland |
| Minimum | 0.54% | 1.5% |
| Maximum | 12.6% | 9.5% |
| Range | 12.1% | 8.0% |
| Mean | 4.7% | 3.9% |
| Median | 4.7% | 3.7% |
| Interquartile 25% (IQ1) | 3.5% | 2.6% |
| Interquartile 75% (IQ3) | 5.4% | 5.0% |
| Interquartile Range (IQR) | 2.0% | 2.3% |
| Standard Deviation (Sample) | 2.0% | 1.9% |
| Standard Deviation (Population) | 2.0% | 1.8% |
Demographics Similar to Immigrants from Serbia and Immigrants from Switzerland by Single Mother Households
In terms of single mother households, the demographic groups most similar to Immigrants from Serbia are Immigrants from Sweden (5.4%, a difference of 0.14%), Estonian (5.4%, a difference of 0.25%), Immigrants from Belgium (5.3%, a difference of 0.43%), Immigrants from Czechoslovakia (5.3%, a difference of 0.58%), and Immigrants from Greece (5.4%, a difference of 0.67%). Similarly, the demographic groups most similar to Immigrants from Switzerland are Bulgarian (5.3%, a difference of 0.020%), Immigrants from Northern Europe (5.3%, a difference of 0.060%), Immigrants from Czechoslovakia (5.3%, a difference of 0.26%), Cambodian (5.3%, a difference of 0.38%), and Immigrants from Korea (5.3%, a difference of 0.39%).
| Demographics | Rating | Rank | Single Mother Households |
| Immigrants | Japan | 99.8 /100 | #25 | Exceptional 5.2% |
| Immigrants | Lithuania | 99.8 /100 | #26 | Exceptional 5.3% |
| Bhutanese | 99.7 /100 | #27 | Exceptional 5.3% |
| Russians | 99.7 /100 | #28 | Exceptional 5.3% |
| Latvians | 99.7 /100 | #29 | Exceptional 5.3% |
| Burmese | 99.7 /100 | #30 | Exceptional 5.3% |
| Immigrants | Korea | 99.7 /100 | #31 | Exceptional 5.3% |
| Cambodians | 99.7 /100 | #32 | Exceptional 5.3% |
| Immigrants | Switzerland | 99.7 /100 | #33 | Exceptional 5.3% |
| Bulgarians | 99.7 /100 | #34 | Exceptional 5.3% |
| Immigrants | Northern Europe | 99.7 /100 | #35 | Exceptional 5.3% |
| Immigrants | Czechoslovakia | 99.7 /100 | #36 | Exceptional 5.3% |
| Immigrants | Belgium | 99.7 /100 | #37 | Exceptional 5.3% |
| Immigrants | Serbia | 99.6 /100 | #38 | Exceptional 5.4% |
| Immigrants | Sweden | 99.6 /100 | #39 | Exceptional 5.4% |
| Estonians | 99.6 /100 | #40 | Exceptional 5.4% |
| Immigrants | Greece | 99.5 /100 | #41 | Exceptional 5.4% |
| Macedonians | 99.5 /100 | #42 | Exceptional 5.4% |
| Immigrants | South Central Asia | 99.5 /100 | #43 | Exceptional 5.4% |
| Lithuanians | 99.4 /100 | #44 | Exceptional 5.4% |
| Immigrants | Croatia | 99.4 /100 | #45 | Exceptional 5.4% |