Immigrants from Serbia vs Bermudan Disability Age 35 to 64
COMPARE
Immigrants from Serbia
Bermudan
Disability Age 35 to 64
Disability Age 35 to 64 Comparison
Immigrants from Serbia
Bermudans
9.8%
DISABILITY AGE 35 TO 64
99.8/ 100
METRIC RATING
48th/ 347
METRIC RANK
11.9%
DISABILITY AGE 35 TO 64
5.0/ 100
METRIC RATING
233rd/ 347
METRIC RANK
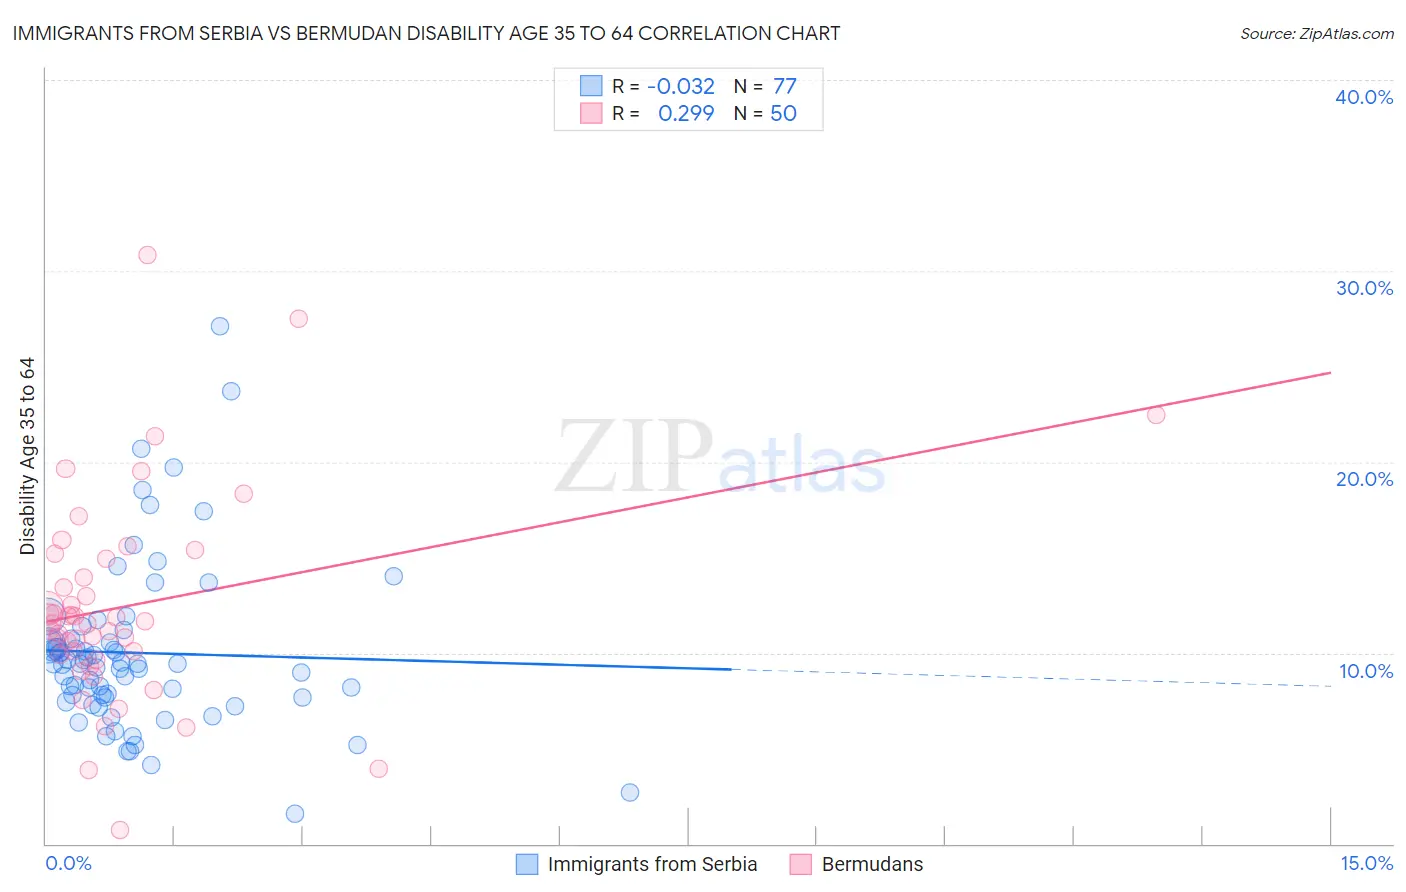
Immigrants from Serbia vs Bermudan Disability Age 35 to 64 Correlation Chart
The statistical analysis conducted on geographies consisting of 131,722,844 people shows no correlation between the proportion of Immigrants from Serbia and percentage of population with a disability between the ages 34 and 64 in the United States with a correlation coefficient (R) of -0.032 and weighted average of 9.8%. Similarly, the statistical analysis conducted on geographies consisting of 55,714,337 people shows a weak positive correlation between the proportion of Bermudans and percentage of population with a disability between the ages 34 and 64 in the United States with a correlation coefficient (R) of 0.299 and weighted average of 11.9%, a difference of 21.6%.
Disability Age 35 to 64 Correlation Summary
| Measurement | Immigrants from Serbia | Bermudan |
| Minimum | 1.6% | 0.71% |
| Maximum | 27.1% | 30.8% |
| Range | 25.5% | 30.1% |
| Mean | 10.0% | 12.5% |
| Median | 9.4% | 11.6% |
| Interquartile 25% (IQ1) | 7.7% | 9.9% |
| Interquartile 75% (IQ3) | 10.7% | 14.9% |
| Interquartile Range (IQR) | 3.0% | 5.1% |
| Standard Deviation (Sample) | 4.4% | 5.5% |
| Standard Deviation (Population) | 4.4% | 5.4% |
Similar Demographics by Disability Age 35 to 64
Demographics Similar to Immigrants from Serbia by Disability Age 35 to 64
In terms of disability age 35 to 64, the demographic groups most similar to Immigrants from Serbia are Immigrants from Belgium (9.8%, a difference of 0.010%), Immigrants from Greece (9.8%, a difference of 0.040%), Cambodian (9.8%, a difference of 0.060%), Paraguayan (9.8%, a difference of 0.11%), and Bhutanese (9.8%, a difference of 0.20%).
| Demographics | Rating | Rank | Disability Age 35 to 64 |
| Israelis | 99.9 /100 | #41 | Exceptional 9.7% |
| Immigrants | Malaysia | 99.9 /100 | #42 | Exceptional 9.7% |
| Immigrants | Colombia | 99.9 /100 | #43 | Exceptional 9.8% |
| Immigrants | Egypt | 99.9 /100 | #44 | Exceptional 9.8% |
| Immigrants | Peru | 99.9 /100 | #45 | Exceptional 9.8% |
| Cambodians | 99.8 /100 | #46 | Exceptional 9.8% |
| Immigrants | Belgium | 99.8 /100 | #47 | Exceptional 9.8% |
| Immigrants | Serbia | 99.8 /100 | #48 | Exceptional 9.8% |
| Immigrants | Greece | 99.8 /100 | #49 | Exceptional 9.8% |
| Paraguayans | 99.8 /100 | #50 | Exceptional 9.8% |
| Bhutanese | 99.8 /100 | #51 | Exceptional 9.8% |
| Immigrants | Bulgaria | 99.8 /100 | #52 | Exceptional 9.8% |
| Taiwanese | 99.8 /100 | #53 | Exceptional 9.8% |
| Immigrants | Russia | 99.8 /100 | #54 | Exceptional 9.8% |
| Peruvians | 99.8 /100 | #55 | Exceptional 9.9% |
Demographics Similar to Bermudans by Disability Age 35 to 64
In terms of disability age 35 to 64, the demographic groups most similar to Bermudans are Portuguese (11.9%, a difference of 0.070%), Sudanese (11.9%, a difference of 0.11%), Belizean (12.0%, a difference of 0.21%), Immigrants from Middle Africa (12.0%, a difference of 0.23%), and Jamaican (11.9%, a difference of 0.25%).
| Demographics | Rating | Rank | Disability Age 35 to 64 |
| Scandinavians | 6.4 /100 | #226 | Tragic 11.9% |
| Immigrants | Central America | 6.3 /100 | #227 | Tragic 11.9% |
| Immigrants | Germany | 6.2 /100 | #228 | Tragic 11.9% |
| British West Indians | 6.1 /100 | #229 | Tragic 11.9% |
| Panamanians | 5.8 /100 | #230 | Tragic 11.9% |
| Jamaicans | 5.7 /100 | #231 | Tragic 11.9% |
| Sudanese | 5.3 /100 | #232 | Tragic 11.9% |
| Bermudans | 5.0 /100 | #233 | Tragic 11.9% |
| Portuguese | 4.9 /100 | #234 | Tragic 11.9% |
| Belizeans | 4.5 /100 | #235 | Tragic 12.0% |
| Immigrants | Middle Africa | 4.5 /100 | #236 | Tragic 12.0% |
| Immigrants | Cambodia | 3.9 /100 | #237 | Tragic 12.0% |
| West Indians | 3.7 /100 | #238 | Tragic 12.0% |
| Immigrants | Western Africa | 3.3 /100 | #239 | Tragic 12.0% |
| Immigrants | Thailand | 3.3 /100 | #240 | Tragic 12.0% |