Immigrants from Scotland vs Irish Currently Married
COMPARE
Immigrants from Scotland
Irish
Currently Married
Currently Married Comparison
Immigrants from Scotland
Irish
49.3%
CURRENTLY MARRIED
99.8/ 100
METRIC RATING
18th/ 347
METRIC RANK
48.9%
CURRENTLY MARRIED
99.5/ 100
METRIC RATING
33rd/ 347
METRIC RANK
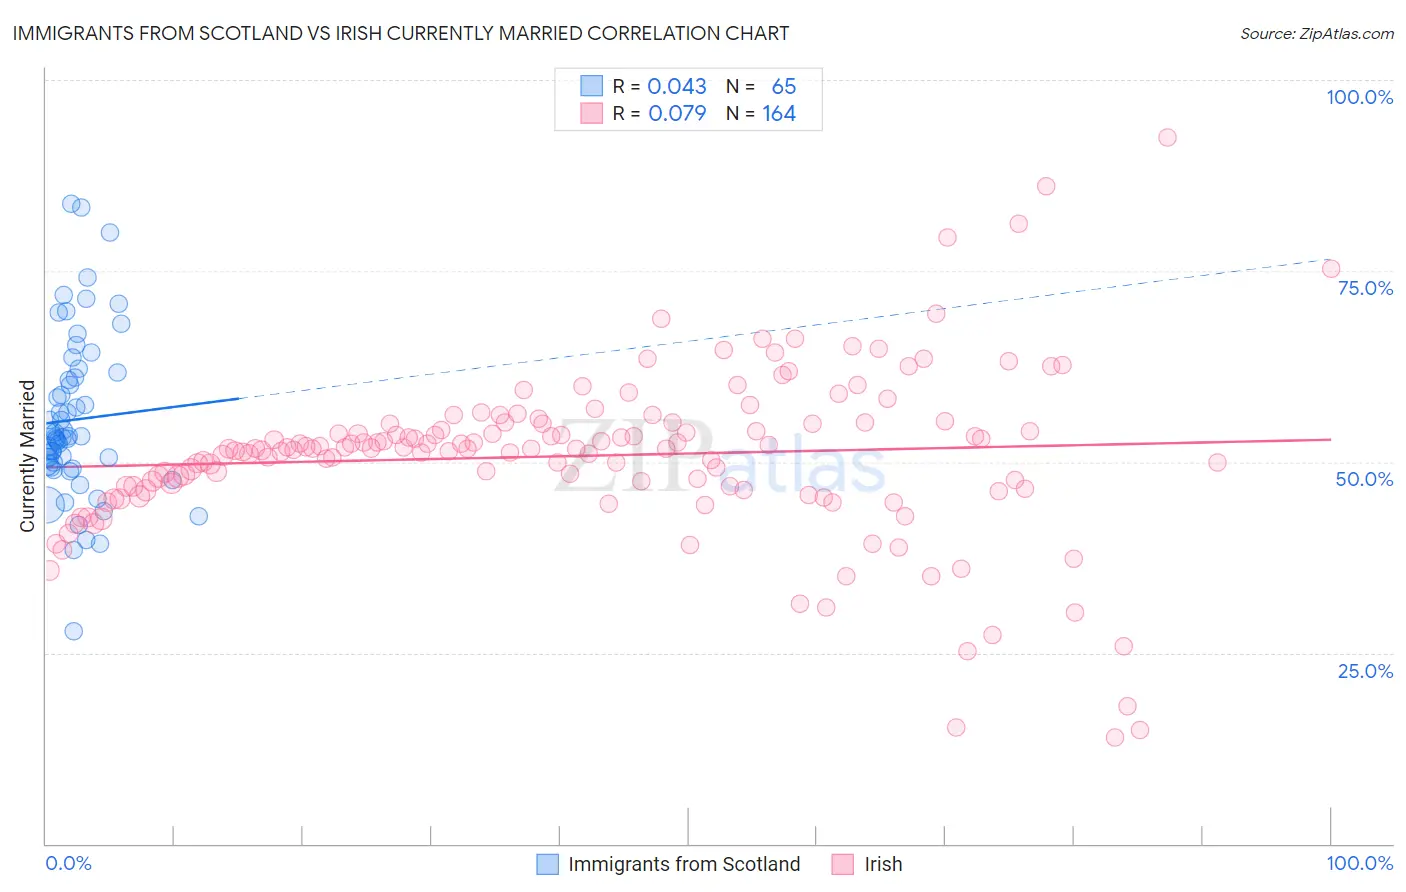
Immigrants from Scotland vs Irish Currently Married Correlation Chart
The statistical analysis conducted on geographies consisting of 196,396,392 people shows no correlation between the proportion of Immigrants from Scotland and percentage of population currently married in the United States with a correlation coefficient (R) of 0.043 and weighted average of 49.3%. Similarly, the statistical analysis conducted on geographies consisting of 580,554,006 people shows a slight positive correlation between the proportion of Irish and percentage of population currently married in the United States with a correlation coefficient (R) of 0.079 and weighted average of 48.9%, a difference of 0.97%.
Currently Married Correlation Summary
| Measurement | Immigrants from Scotland | Irish |
| Minimum | 27.9% | 13.9% |
| Maximum | 83.8% | 92.5% |
| Range | 55.9% | 78.6% |
| Mean | 55.5% | 50.8% |
| Median | 53.2% | 51.7% |
| Interquartile 25% (IQ1) | 49.5% | 46.6% |
| Interquartile 75% (IQ3) | 61.4% | 55.0% |
| Interquartile Range (IQR) | 11.9% | 8.4% |
| Standard Deviation (Sample) | 10.7% | 11.2% |
| Standard Deviation (Population) | 10.7% | 11.1% |
Demographics Similar to Immigrants from Scotland and Irish by Currently Married
In terms of currently married, the demographic groups most similar to Immigrants from Scotland are European (49.3%, a difference of 0.020%), Luxembourger (49.3%, a difference of 0.15%), Scottish (49.2%, a difference of 0.26%), Scandinavian (49.5%, a difference of 0.29%), and Chinese (49.5%, a difference of 0.31%). Similarly, the demographic groups most similar to Irish are Immigrants from Hong Kong (48.9%, a difference of 0.040%), Eastern European (48.9%, a difference of 0.050%), Polish (48.9%, a difference of 0.050%), Croatian (48.9%, a difference of 0.060%), and Immigrants from Lithuania (48.8%, a difference of 0.060%).
| Demographics | Rating | Rank | Currently Married |
| Pennsylvania Germans | 99.9 /100 | #15 | Exceptional 49.6% |
| Chinese | 99.9 /100 | #16 | Exceptional 49.5% |
| Scandinavians | 99.9 /100 | #17 | Exceptional 49.5% |
| Immigrants | Scotland | 99.8 /100 | #18 | Exceptional 49.3% |
| Europeans | 99.8 /100 | #19 | Exceptional 49.3% |
| Luxembourgers | 99.8 /100 | #20 | Exceptional 49.3% |
| Scottish | 99.8 /100 | #21 | Exceptional 49.2% |
| Bulgarians | 99.7 /100 | #22 | Exceptional 49.1% |
| Immigrants | Pakistan | 99.7 /100 | #23 | Exceptional 49.1% |
| Lithuanians | 99.6 /100 | #24 | Exceptional 49.0% |
| Maltese | 99.6 /100 | #25 | Exceptional 49.0% |
| Immigrants | Korea | 99.6 /100 | #26 | Exceptional 49.0% |
| Burmese | 99.6 /100 | #27 | Exceptional 48.9% |
| Welsh | 99.5 /100 | #28 | Exceptional 48.9% |
| Croatians | 99.5 /100 | #29 | Exceptional 48.9% |
| Eastern Europeans | 99.5 /100 | #30 | Exceptional 48.9% |
| Poles | 99.5 /100 | #31 | Exceptional 48.9% |
| Immigrants | Hong Kong | 99.5 /100 | #32 | Exceptional 48.9% |
| Irish | 99.5 /100 | #33 | Exceptional 48.9% |
| Immigrants | Lithuania | 99.4 /100 | #34 | Exceptional 48.8% |
| Immigrants | Northern Europe | 99.4 /100 | #35 | Exceptional 48.8% |