Immigrants from Scotland vs Egyptian Currently Married
COMPARE
Immigrants from Scotland
Egyptian
Currently Married
Currently Married Comparison
Immigrants from Scotland
Egyptians
49.3%
CURRENTLY MARRIED
99.8/ 100
METRIC RATING
18th/ 347
METRIC RANK
47.9%
CURRENTLY MARRIED
94.8/ 100
METRIC RATING
96th/ 347
METRIC RANK
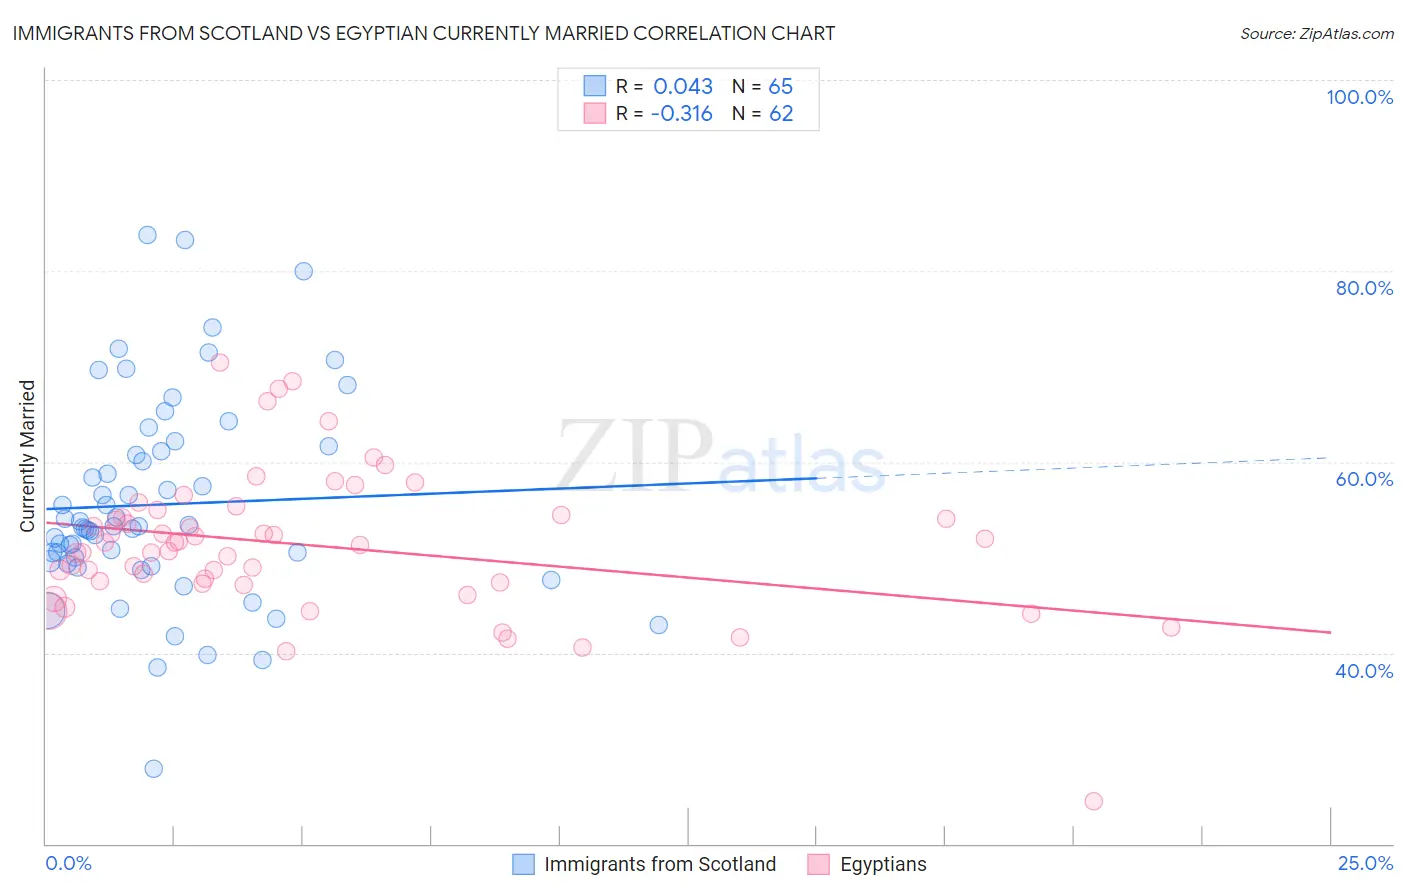
Immigrants from Scotland vs Egyptian Currently Married Correlation Chart
The statistical analysis conducted on geographies consisting of 196,396,392 people shows no correlation between the proportion of Immigrants from Scotland and percentage of population currently married in the United States with a correlation coefficient (R) of 0.043 and weighted average of 49.3%. Similarly, the statistical analysis conducted on geographies consisting of 276,890,367 people shows a mild negative correlation between the proportion of Egyptians and percentage of population currently married in the United States with a correlation coefficient (R) of -0.316 and weighted average of 47.9%, a difference of 3.1%.
Currently Married Correlation Summary
| Measurement | Immigrants from Scotland | Egyptian |
| Minimum | 27.9% | 24.4% |
| Maximum | 83.8% | 70.4% |
| Range | 55.9% | 46.0% |
| Mean | 55.5% | 51.3% |
| Median | 53.2% | 51.4% |
| Interquartile 25% (IQ1) | 49.5% | 47.4% |
| Interquartile 75% (IQ3) | 61.4% | 54.4% |
| Interquartile Range (IQR) | 11.9% | 7.0% |
| Standard Deviation (Sample) | 10.7% | 7.5% |
| Standard Deviation (Population) | 10.7% | 7.5% |
Similar Demographics by Currently Married
Demographics Similar to Immigrants from Scotland by Currently Married
In terms of currently married, the demographic groups most similar to Immigrants from Scotland are European (49.3%, a difference of 0.020%), Luxembourger (49.3%, a difference of 0.15%), Scottish (49.2%, a difference of 0.26%), Scandinavian (49.5%, a difference of 0.29%), and Chinese (49.5%, a difference of 0.31%).
| Demographics | Rating | Rank | Currently Married |
| English | 99.9 /100 | #11 | Exceptional 49.7% |
| Swiss | 99.9 /100 | #12 | Exceptional 49.7% |
| Dutch | 99.9 /100 | #13 | Exceptional 49.6% |
| Germans | 99.9 /100 | #14 | Exceptional 49.6% |
| Pennsylvania Germans | 99.9 /100 | #15 | Exceptional 49.6% |
| Chinese | 99.9 /100 | #16 | Exceptional 49.5% |
| Scandinavians | 99.9 /100 | #17 | Exceptional 49.5% |
| Immigrants | Scotland | 99.8 /100 | #18 | Exceptional 49.3% |
| Europeans | 99.8 /100 | #19 | Exceptional 49.3% |
| Luxembourgers | 99.8 /100 | #20 | Exceptional 49.3% |
| Scottish | 99.8 /100 | #21 | Exceptional 49.2% |
| Bulgarians | 99.7 /100 | #22 | Exceptional 49.1% |
| Immigrants | Pakistan | 99.7 /100 | #23 | Exceptional 49.1% |
| Lithuanians | 99.6 /100 | #24 | Exceptional 49.0% |
| Maltese | 99.6 /100 | #25 | Exceptional 49.0% |
Demographics Similar to Egyptians by Currently Married
In terms of currently married, the demographic groups most similar to Egyptians are Immigrants from Bulgaria (47.9%, a difference of 0.0%), Immigrants from Ukraine (47.9%, a difference of 0.010%), Immigrants from China (47.9%, a difference of 0.020%), Native Hawaiian (47.9%, a difference of 0.040%), and Lebanese (47.9%, a difference of 0.050%).
| Demographics | Rating | Rank | Currently Married |
| Indians (Asian) | 95.8 /100 | #89 | Exceptional 48.0% |
| Americans | 95.7 /100 | #90 | Exceptional 48.0% |
| Immigrants | Bolivia | 95.6 /100 | #91 | Exceptional 47.9% |
| Koreans | 95.4 /100 | #92 | Exceptional 47.9% |
| Lebanese | 95.1 /100 | #93 | Exceptional 47.9% |
| Native Hawaiians | 95.0 /100 | #94 | Exceptional 47.9% |
| Immigrants | Bulgaria | 94.8 /100 | #95 | Exceptional 47.9% |
| Egyptians | 94.8 /100 | #96 | Exceptional 47.9% |
| Immigrants | Ukraine | 94.8 /100 | #97 | Exceptional 47.9% |
| Immigrants | China | 94.7 /100 | #98 | Exceptional 47.9% |
| Immigrants | Sweden | 94.3 /100 | #99 | Exceptional 47.8% |
| Celtics | 94.2 /100 | #100 | Exceptional 47.8% |
| Immigrants | Germany | 94.1 /100 | #101 | Exceptional 47.8% |
| Turks | 93.9 /100 | #102 | Exceptional 47.8% |
| Cypriots | 93.7 /100 | #103 | Exceptional 47.8% |