Immigrants from Scotland vs Immigrants from West Indies Married-couple Households
COMPARE
Immigrants from Scotland
Immigrants from West Indies
Married-couple Households
Married-couple Households Comparison
Immigrants from Scotland
Immigrants from West Indies
49.3%
MARRIED-COUPLE HOUSEHOLDS
99.8/ 100
METRIC RATING
26th/ 347
METRIC RANK
39.0%
MARRIED-COUPLE HOUSEHOLDS
0.0/ 100
METRIC RATING
333rd/ 347
METRIC RANK
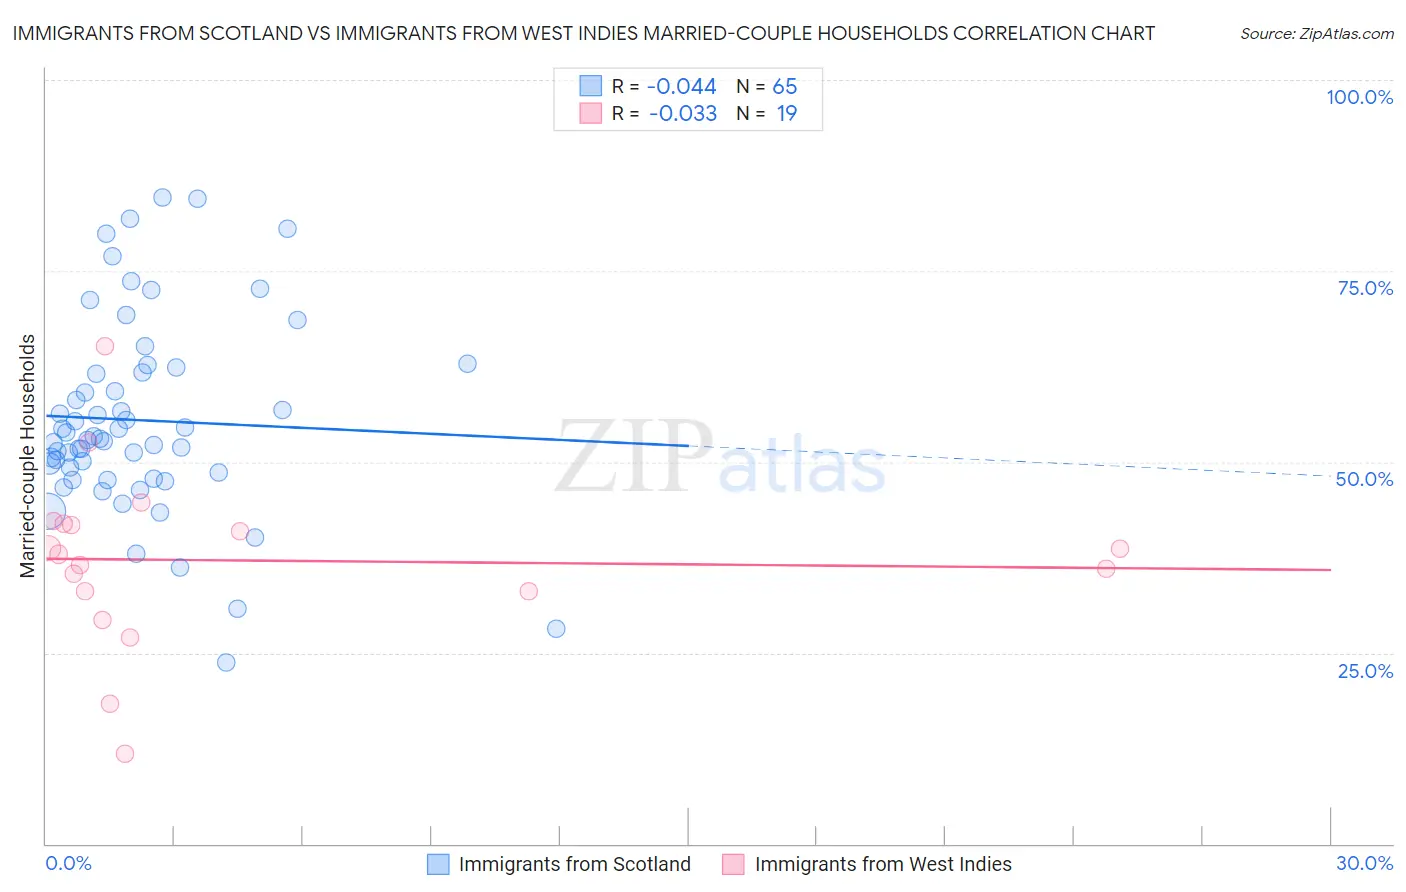
Immigrants from Scotland vs Immigrants from West Indies Married-couple Households Correlation Chart
The statistical analysis conducted on geographies consisting of 196,383,501 people shows no correlation between the proportion of Immigrants from Scotland and percentage of married-couple family households in the United States with a correlation coefficient (R) of -0.044 and weighted average of 49.3%. Similarly, the statistical analysis conducted on geographies consisting of 72,454,628 people shows no correlation between the proportion of Immigrants from West Indies and percentage of married-couple family households in the United States with a correlation coefficient (R) of -0.033 and weighted average of 39.0%, a difference of 26.4%.
Married-couple Households Correlation Summary
| Measurement | Immigrants from Scotland | Immigrants from West Indies |
| Minimum | 23.8% | 11.8% |
| Maximum | 84.6% | 65.1% |
| Range | 60.9% | 53.3% |
| Mean | 55.5% | 37.1% |
| Median | 53.0% | 37.9% |
| Interquartile 25% (IQ1) | 48.2% | 33.1% |
| Interquartile 75% (IQ3) | 62.1% | 41.9% |
| Interquartile Range (IQR) | 13.9% | 8.8% |
| Standard Deviation (Sample) | 12.8% | 11.5% |
| Standard Deviation (Population) | 12.7% | 11.1% |
Similar Demographics by Married-couple Households
Demographics Similar to Immigrants from Scotland by Married-couple Households
In terms of married-couple households, the demographic groups most similar to Immigrants from Scotland are Bhutanese (49.3%, a difference of 0.020%), Immigrants from Philippines (49.3%, a difference of 0.13%), German (49.2%, a difference of 0.21%), Maltese (49.2%, a difference of 0.22%), and Bolivian (49.2%, a difference of 0.23%).
| Demographics | Rating | Rank | Married-couple Households |
| Europeans | 99.9 /100 | #19 | Exceptional 49.6% |
| Scandinavians | 99.9 /100 | #20 | Exceptional 49.6% |
| Norwegians | 99.9 /100 | #21 | Exceptional 49.5% |
| Asians | 99.9 /100 | #22 | Exceptional 49.5% |
| Dutch | 99.9 /100 | #23 | Exceptional 49.5% |
| Czechs | 99.9 /100 | #24 | Exceptional 49.4% |
| Immigrants | Philippines | 99.9 /100 | #25 | Exceptional 49.3% |
| Immigrants | Scotland | 99.8 /100 | #26 | Exceptional 49.3% |
| Bhutanese | 99.8 /100 | #27 | Exceptional 49.3% |
| Germans | 99.8 /100 | #28 | Exceptional 49.2% |
| Maltese | 99.8 /100 | #29 | Exceptional 49.2% |
| Bolivians | 99.8 /100 | #30 | Exceptional 49.2% |
| Native Hawaiians | 99.8 /100 | #31 | Exceptional 49.1% |
| Hungarians | 99.8 /100 | #32 | Exceptional 49.1% |
| Immigrants | Asia | 99.7 /100 | #33 | Exceptional 49.1% |
Demographics Similar to Immigrants from West Indies by Married-couple Households
In terms of married-couple households, the demographic groups most similar to Immigrants from West Indies are Somali (39.0%, a difference of 0.030%), Immigrants from Congo (39.0%, a difference of 0.12%), Immigrants from Barbados (39.2%, a difference of 0.56%), Immigrants from St. Vincent and the Grenadines (38.7%, a difference of 0.78%), and Immigrants from Dominica (39.4%, a difference of 1.0%).
| Demographics | Rating | Rank | Married-couple Households |
| U.S. Virgin Islanders | 0.0 /100 | #326 | Tragic 39.8% |
| Lumbee | 0.0 /100 | #327 | Tragic 39.6% |
| Barbadians | 0.0 /100 | #328 | Tragic 39.4% |
| Immigrants | Dominica | 0.0 /100 | #329 | Tragic 39.4% |
| Immigrants | Barbados | 0.0 /100 | #330 | Tragic 39.2% |
| Immigrants | Congo | 0.0 /100 | #331 | Tragic 39.0% |
| Somalis | 0.0 /100 | #332 | Tragic 39.0% |
| Immigrants | West Indies | 0.0 /100 | #333 | Tragic 39.0% |
| Immigrants | St. Vincent and the Grenadines | 0.0 /100 | #334 | Tragic 38.7% |
| Senegalese | 0.0 /100 | #335 | Tragic 38.6% |
| Blacks/African Americans | 0.0 /100 | #336 | Tragic 38.5% |
| Immigrants | Somalia | 0.0 /100 | #337 | Tragic 38.4% |
| Immigrants | Senegal | 0.0 /100 | #338 | Tragic 38.4% |
| British West Indians | 0.0 /100 | #339 | Tragic 38.3% |
| Dominicans | 0.0 /100 | #340 | Tragic 38.2% |