Tlingit-Haida vs Immigrants from West Indies Married-couple Households
COMPARE
Tlingit-Haida
Immigrants from West Indies
Married-couple Households
Married-couple Households Comparison
Tlingit-Haida
Immigrants from West Indies
45.1%
MARRIED-COUPLE HOUSEHOLDS
4.9/ 100
METRIC RATING
221st/ 347
METRIC RANK
39.0%
MARRIED-COUPLE HOUSEHOLDS
0.0/ 100
METRIC RATING
333rd/ 347
METRIC RANK
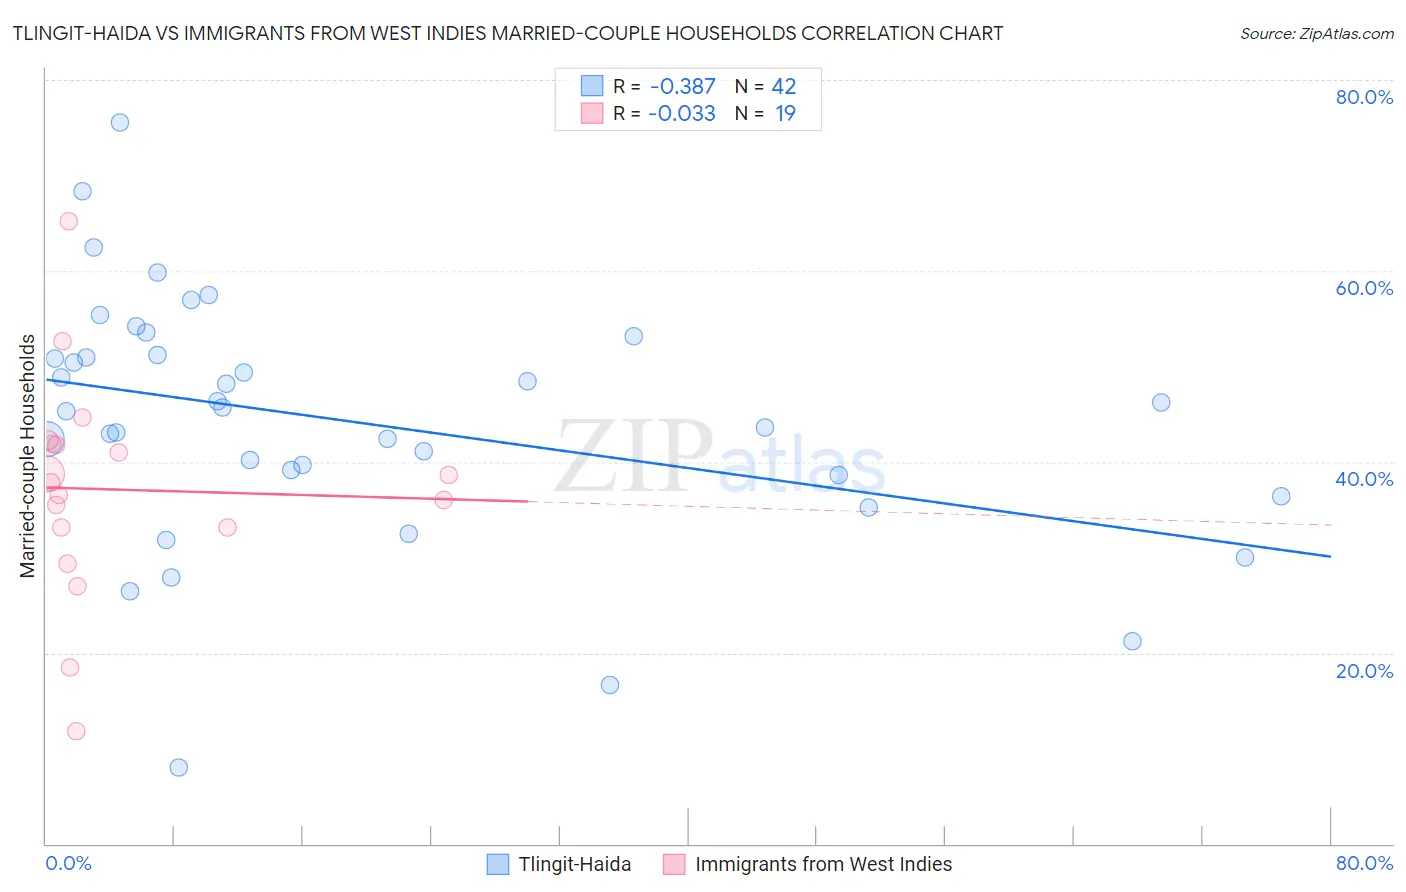
Tlingit-Haida vs Immigrants from West Indies Married-couple Households Correlation Chart
The statistical analysis conducted on geographies consisting of 60,855,605 people shows a mild negative correlation between the proportion of Tlingit-Haida and percentage of married-couple family households in the United States with a correlation coefficient (R) of -0.387 and weighted average of 45.1%. Similarly, the statistical analysis conducted on geographies consisting of 72,454,628 people shows no correlation between the proportion of Immigrants from West Indies and percentage of married-couple family households in the United States with a correlation coefficient (R) of -0.033 and weighted average of 39.0%, a difference of 15.8%.
Married-couple Households Correlation Summary
| Measurement | Tlingit-Haida | Immigrants from West Indies |
| Minimum | 8.0% | 11.8% |
| Maximum | 75.5% | 65.1% |
| Range | 67.5% | 53.3% |
| Mean | 44.2% | 37.1% |
| Median | 45.5% | 37.9% |
| Interquartile 25% (IQ1) | 38.7% | 33.1% |
| Interquartile 75% (IQ3) | 51.2% | 41.9% |
| Interquartile Range (IQR) | 12.6% | 8.8% |
| Standard Deviation (Sample) | 13.1% | 11.5% |
| Standard Deviation (Population) | 13.0% | 11.1% |
Similar Demographics by Married-couple Households
Demographics Similar to Tlingit-Haida by Married-couple Households
In terms of married-couple households, the demographic groups most similar to Tlingit-Haida are Immigrants from Thailand (45.2%, a difference of 0.050%), Immigrants from Laos (45.1%, a difference of 0.050%), Nicaraguan (45.2%, a difference of 0.080%), Immigrants from the Azores (45.2%, a difference of 0.090%), and Panamanian (45.2%, a difference of 0.11%).
| Demographics | Rating | Rank | Married-couple Households |
| Japanese | 5.7 /100 | #214 | Tragic 45.2% |
| Immigrants | Nepal | 5.6 /100 | #215 | Tragic 45.2% |
| Immigrants | Portugal | 5.6 /100 | #216 | Tragic 45.2% |
| Panamanians | 5.5 /100 | #217 | Tragic 45.2% |
| Immigrants | Azores | 5.3 /100 | #218 | Tragic 45.2% |
| Nicaraguans | 5.3 /100 | #219 | Tragic 45.2% |
| Immigrants | Thailand | 5.1 /100 | #220 | Tragic 45.2% |
| Tlingit-Haida | 4.9 /100 | #221 | Tragic 45.1% |
| Immigrants | Laos | 4.6 /100 | #222 | Tragic 45.1% |
| Immigrants | Cambodia | 2.7 /100 | #223 | Tragic 44.9% |
| Immigrants | Micronesia | 2.6 /100 | #224 | Tragic 44.9% |
| Dutch West Indians | 2.6 /100 | #225 | Tragic 44.9% |
| Alsatians | 2.3 /100 | #226 | Tragic 44.8% |
| Salvadorans | 1.9 /100 | #227 | Tragic 44.7% |
| Kenyans | 1.7 /100 | #228 | Tragic 44.7% |
Demographics Similar to Immigrants from West Indies by Married-couple Households
In terms of married-couple households, the demographic groups most similar to Immigrants from West Indies are Somali (39.0%, a difference of 0.030%), Immigrants from Congo (39.0%, a difference of 0.12%), Immigrants from Barbados (39.2%, a difference of 0.56%), Immigrants from St. Vincent and the Grenadines (38.7%, a difference of 0.78%), and Immigrants from Dominica (39.4%, a difference of 1.0%).
| Demographics | Rating | Rank | Married-couple Households |
| U.S. Virgin Islanders | 0.0 /100 | #326 | Tragic 39.8% |
| Lumbee | 0.0 /100 | #327 | Tragic 39.6% |
| Barbadians | 0.0 /100 | #328 | Tragic 39.4% |
| Immigrants | Dominica | 0.0 /100 | #329 | Tragic 39.4% |
| Immigrants | Barbados | 0.0 /100 | #330 | Tragic 39.2% |
| Immigrants | Congo | 0.0 /100 | #331 | Tragic 39.0% |
| Somalis | 0.0 /100 | #332 | Tragic 39.0% |
| Immigrants | West Indies | 0.0 /100 | #333 | Tragic 39.0% |
| Immigrants | St. Vincent and the Grenadines | 0.0 /100 | #334 | Tragic 38.7% |
| Senegalese | 0.0 /100 | #335 | Tragic 38.6% |
| Blacks/African Americans | 0.0 /100 | #336 | Tragic 38.5% |
| Immigrants | Somalia | 0.0 /100 | #337 | Tragic 38.4% |
| Immigrants | Senegal | 0.0 /100 | #338 | Tragic 38.4% |
| British West Indians | 0.0 /100 | #339 | Tragic 38.3% |
| Dominicans | 0.0 /100 | #340 | Tragic 38.2% |