Portuguese vs Immigrants from West Indies Married-couple Households
COMPARE
Portuguese
Immigrants from West Indies
Married-couple Households
Married-couple Households Comparison
Portuguese
Immigrants from West Indies
47.8%
MARRIED-COUPLE HOUSEHOLDS
95.5/ 100
METRIC RATING
106th/ 347
METRIC RANK
39.0%
MARRIED-COUPLE HOUSEHOLDS
0.0/ 100
METRIC RATING
333rd/ 347
METRIC RANK
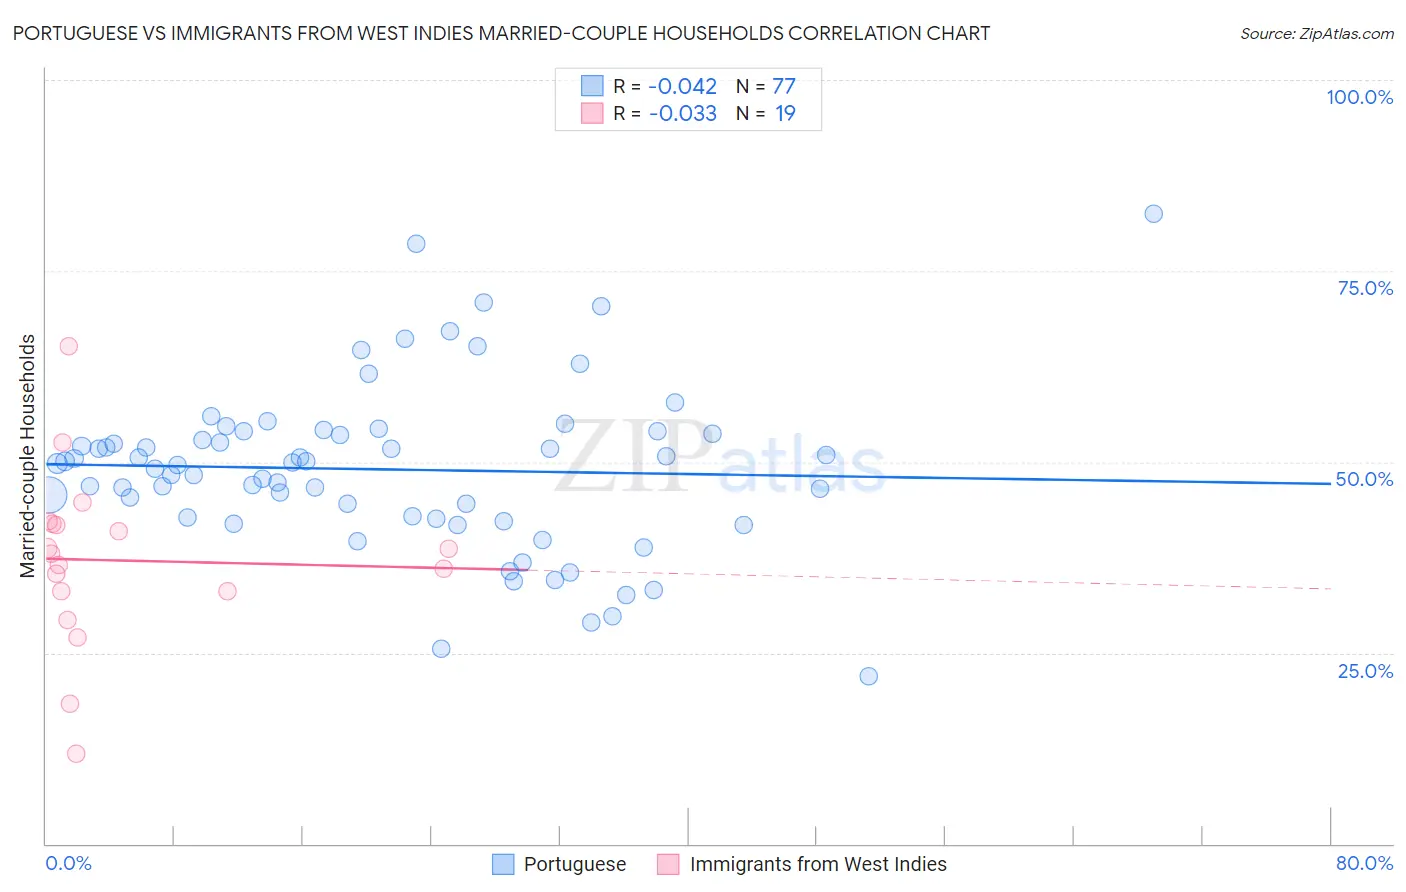
Portuguese vs Immigrants from West Indies Married-couple Households Correlation Chart
The statistical analysis conducted on geographies consisting of 449,970,895 people shows no correlation between the proportion of Portuguese and percentage of married-couple family households in the United States with a correlation coefficient (R) of -0.042 and weighted average of 47.8%. Similarly, the statistical analysis conducted on geographies consisting of 72,454,628 people shows no correlation between the proportion of Immigrants from West Indies and percentage of married-couple family households in the United States with a correlation coefficient (R) of -0.033 and weighted average of 39.0%, a difference of 22.6%.
Married-couple Households Correlation Summary
| Measurement | Portuguese | Immigrants from West Indies |
| Minimum | 21.9% | 11.8% |
| Maximum | 82.5% | 65.1% |
| Range | 60.6% | 53.3% |
| Mean | 49.0% | 37.1% |
| Median | 49.8% | 37.9% |
| Interquartile 25% (IQ1) | 42.6% | 33.1% |
| Interquartile 75% (IQ3) | 53.9% | 41.9% |
| Interquartile Range (IQR) | 11.3% | 8.8% |
| Standard Deviation (Sample) | 10.9% | 11.5% |
| Standard Deviation (Population) | 10.9% | 11.1% |
Similar Demographics by Married-couple Households
Demographics Similar to Portuguese by Married-couple Households
In terms of married-couple households, the demographic groups most similar to Portuguese are Immigrants from Czechoslovakia (47.8%, a difference of 0.010%), Immigrants from South Africa (47.8%, a difference of 0.11%), Slavic (47.8%, a difference of 0.12%), Hawaiian (47.8%, a difference of 0.12%), and Turkish (47.8%, a difference of 0.14%).
| Demographics | Rating | Rank | Married-couple Households |
| Immigrants | Austria | 96.4 /100 | #99 | Exceptional 47.9% |
| Immigrants | Italy | 96.3 /100 | #100 | Exceptional 47.9% |
| Turks | 96.1 /100 | #101 | Exceptional 47.8% |
| Slavs | 96.0 /100 | #102 | Exceptional 47.8% |
| Hawaiians | 96.0 /100 | #103 | Exceptional 47.8% |
| Immigrants | South Africa | 96.0 /100 | #104 | Exceptional 47.8% |
| Immigrants | Czechoslovakia | 95.5 /100 | #105 | Exceptional 47.8% |
| Portuguese | 95.5 /100 | #106 | Exceptional 47.8% |
| Estonians | 94.7 /100 | #107 | Exceptional 47.7% |
| Immigrants | Japan | 94.4 /100 | #108 | Exceptional 47.7% |
| Immigrants | Jordan | 94.1 /100 | #109 | Exceptional 47.7% |
| Macedonians | 93.9 /100 | #110 | Exceptional 47.6% |
| Syrians | 93.9 /100 | #111 | Exceptional 47.6% |
| Peruvians | 93.8 /100 | #112 | Exceptional 47.6% |
| Venezuelans | 93.8 /100 | #113 | Exceptional 47.6% |
Demographics Similar to Immigrants from West Indies by Married-couple Households
In terms of married-couple households, the demographic groups most similar to Immigrants from West Indies are Somali (39.0%, a difference of 0.030%), Immigrants from Congo (39.0%, a difference of 0.12%), Immigrants from Barbados (39.2%, a difference of 0.56%), Immigrants from St. Vincent and the Grenadines (38.7%, a difference of 0.78%), and Immigrants from Dominica (39.4%, a difference of 1.0%).
| Demographics | Rating | Rank | Married-couple Households |
| U.S. Virgin Islanders | 0.0 /100 | #326 | Tragic 39.8% |
| Lumbee | 0.0 /100 | #327 | Tragic 39.6% |
| Barbadians | 0.0 /100 | #328 | Tragic 39.4% |
| Immigrants | Dominica | 0.0 /100 | #329 | Tragic 39.4% |
| Immigrants | Barbados | 0.0 /100 | #330 | Tragic 39.2% |
| Immigrants | Congo | 0.0 /100 | #331 | Tragic 39.0% |
| Somalis | 0.0 /100 | #332 | Tragic 39.0% |
| Immigrants | West Indies | 0.0 /100 | #333 | Tragic 39.0% |
| Immigrants | St. Vincent and the Grenadines | 0.0 /100 | #334 | Tragic 38.7% |
| Senegalese | 0.0 /100 | #335 | Tragic 38.6% |
| Blacks/African Americans | 0.0 /100 | #336 | Tragic 38.5% |
| Immigrants | Somalia | 0.0 /100 | #337 | Tragic 38.4% |
| Immigrants | Senegal | 0.0 /100 | #338 | Tragic 38.4% |
| British West Indians | 0.0 /100 | #339 | Tragic 38.3% |
| Dominicans | 0.0 /100 | #340 | Tragic 38.2% |