Immigrants from Saudi Arabia vs Aleut Births to Unmarried Women
COMPARE
Immigrants from Saudi Arabia
Aleut
Births to Unmarried Women
Births to Unmarried Women Comparison
Immigrants from Saudi Arabia
Aleuts
29.1%
BIRTHS TO UNMARRIED WOMEN
97.0/ 100
METRIC RATING
89th/ 347
METRIC RANK
39.3%
BIRTHS TO UNMARRIED WOMEN
0.0/ 100
METRIC RATING
308th/ 347
METRIC RANK
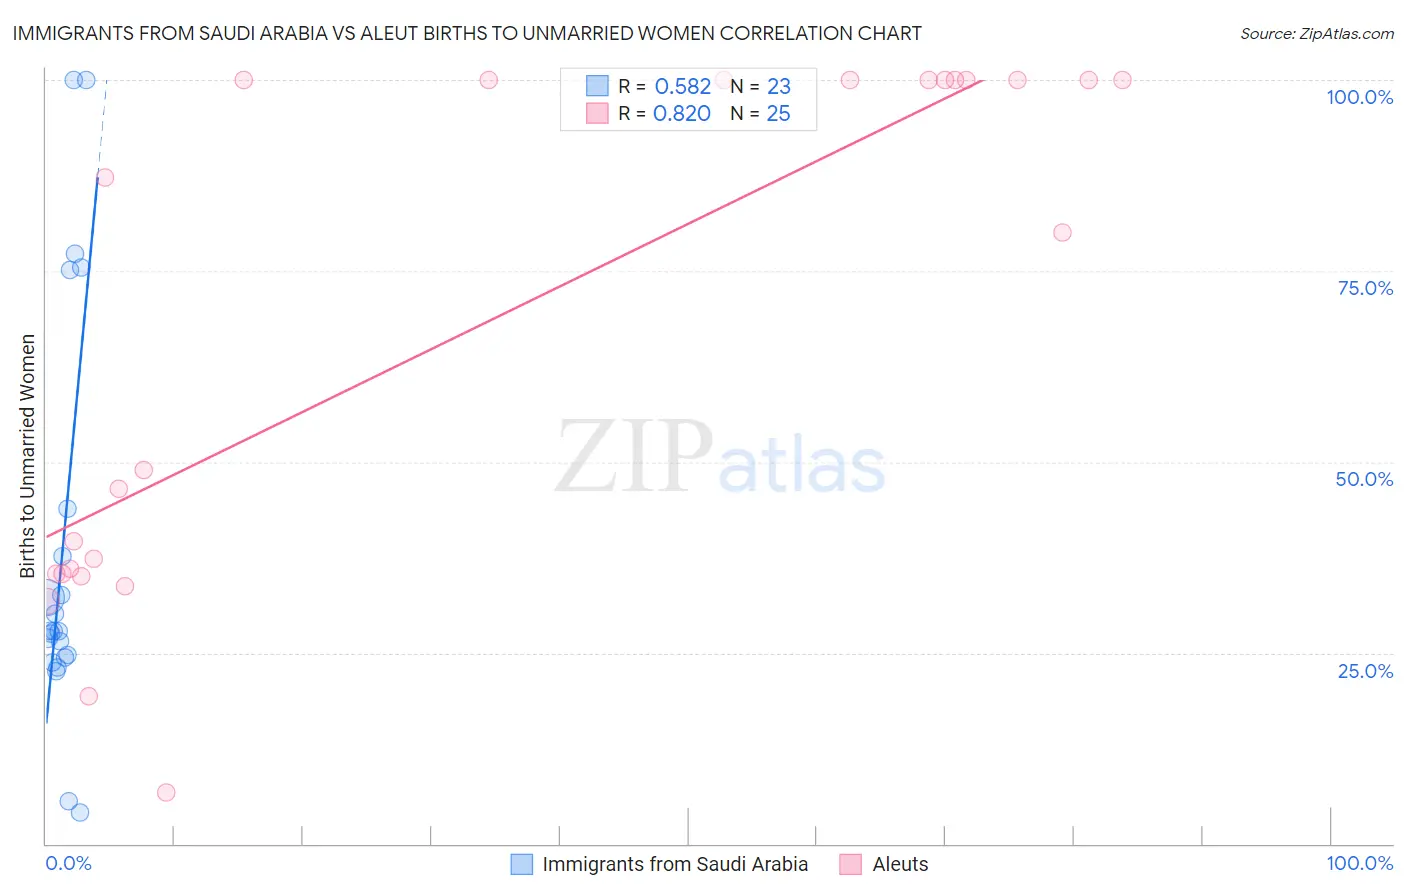
Immigrants from Saudi Arabia vs Aleut Births to Unmarried Women Correlation Chart
The statistical analysis conducted on geographies consisting of 158,618,627 people shows a substantial positive correlation between the proportion of Immigrants from Saudi Arabia and percentage of births to unmarried women in the United States with a correlation coefficient (R) of 0.582 and weighted average of 29.1%. Similarly, the statistical analysis conducted on geographies consisting of 60,596,367 people shows a very strong positive correlation between the proportion of Aleuts and percentage of births to unmarried women in the United States with a correlation coefficient (R) of 0.820 and weighted average of 39.3%, a difference of 35.4%.
Births to Unmarried Women Correlation Summary
| Measurement | Immigrants from Saudi Arabia | Aleut |
| Minimum | 4.0% | 6.7% |
| Maximum | 100.0% | 100.0% |
| Range | 96.0% | 93.3% |
| Mean | 39.0% | 66.9% |
| Median | 27.8% | 80.0% |
| Interquartile 25% (IQ1) | 24.4% | 35.3% |
| Interquartile 75% (IQ3) | 43.8% | 100.0% |
| Interquartile Range (IQR) | 19.4% | 64.7% |
| Standard Deviation (Sample) | 27.0% | 33.7% |
| Standard Deviation (Population) | 26.4% | 33.0% |
Similar Demographics by Births to Unmarried Women
Demographics Similar to Immigrants from Saudi Arabia by Births to Unmarried Women
In terms of births to unmarried women, the demographic groups most similar to Immigrants from Saudi Arabia are Immigrants from Latvia (29.1%, a difference of 0.16%), Taiwanese (29.0%, a difference of 0.28%), Immigrants from France (29.0%, a difference of 0.28%), Immigrants from Jordan (29.0%, a difference of 0.36%), and Immigrants from Fiji (29.2%, a difference of 0.37%).
| Demographics | Rating | Rank | Births to Unmarried Women |
| Romanians | 98.0 /100 | #82 | Exceptional 28.7% |
| Immigrants | Kuwait | 98.0 /100 | #83 | Exceptional 28.8% |
| Immigrants | Poland | 97.6 /100 | #84 | Exceptional 28.9% |
| Sri Lankans | 97.5 /100 | #85 | Exceptional 28.9% |
| Immigrants | Jordan | 97.4 /100 | #86 | Exceptional 29.0% |
| Taiwanese | 97.3 /100 | #87 | Exceptional 29.0% |
| Immigrants | France | 97.3 /100 | #88 | Exceptional 29.0% |
| Immigrants | Saudi Arabia | 97.0 /100 | #89 | Exceptional 29.1% |
| Immigrants | Latvia | 96.8 /100 | #90 | Exceptional 29.1% |
| Immigrants | Fiji | 96.6 /100 | #91 | Exceptional 29.2% |
| Arabs | 96.5 /100 | #92 | Exceptional 29.2% |
| Estonians | 96.5 /100 | #93 | Exceptional 29.2% |
| Ukrainians | 96.3 /100 | #94 | Exceptional 29.2% |
| Immigrants | Vietnam | 96.1 /100 | #95 | Exceptional 29.3% |
| Norwegians | 95.8 /100 | #96 | Exceptional 29.3% |
Demographics Similar to Aleuts by Births to Unmarried Women
In terms of births to unmarried women, the demographic groups most similar to Aleuts are Immigrants from Honduras (39.3%, a difference of 0.090%), Cuban (39.4%, a difference of 0.12%), Immigrants from Dominica (39.5%, a difference of 0.34%), Immigrants from the Azores (39.6%, a difference of 0.58%), and U.S. Virgin Islander (39.6%, a difference of 0.60%).
| Demographics | Rating | Rank | Births to Unmarried Women |
| Haitians | 0.0 /100 | #301 | Tragic 38.6% |
| Hondurans | 0.0 /100 | #302 | Tragic 38.7% |
| Immigrants | Jamaica | 0.0 /100 | #303 | Tragic 38.8% |
| Yaqui | 0.0 /100 | #304 | Tragic 38.8% |
| Immigrants | Haiti | 0.0 /100 | #305 | Tragic 38.9% |
| Central American Indians | 0.0 /100 | #306 | Tragic 39.0% |
| Immigrants | Honduras | 0.0 /100 | #307 | Tragic 39.3% |
| Aleuts | 0.0 /100 | #308 | Tragic 39.3% |
| Cubans | 0.0 /100 | #309 | Tragic 39.4% |
| Immigrants | Dominica | 0.0 /100 | #310 | Tragic 39.5% |
| Immigrants | Azores | 0.0 /100 | #311 | Tragic 39.6% |
| U.S. Virgin Islanders | 0.0 /100 | #312 | Tragic 39.6% |
| Africans | 0.0 /100 | #313 | Tragic 39.7% |
| Immigrants | Caribbean | 0.0 /100 | #314 | Tragic 39.8% |
| Dominicans | 0.0 /100 | #315 | Tragic 39.8% |