Immigrants from Russia vs Tlingit-Haida Divorced or Separated
COMPARE
Immigrants from Russia
Tlingit-Haida
Divorced or Separated
Divorced or Separated Comparison
Immigrants from Russia
Tlingit-Haida
11.3%
DIVORCED OR SEPARATED
99.9/ 100
METRIC RATING
60th/ 347
METRIC RANK
13.2%
DIVORCED OR SEPARATED
0.0/ 100
METRIC RATING
306th/ 347
METRIC RANK
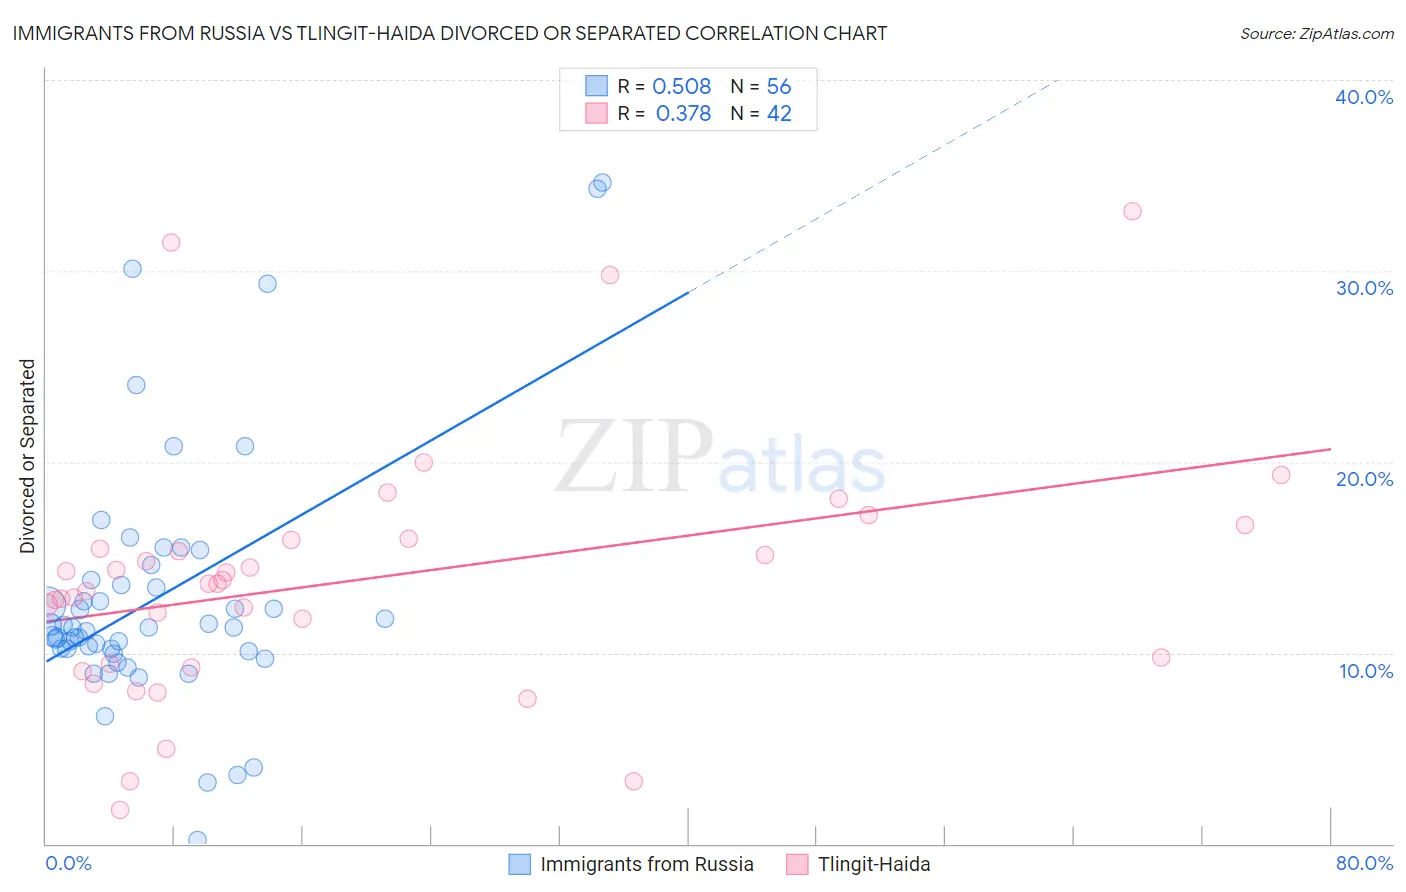
Immigrants from Russia vs Tlingit-Haida Divorced or Separated Correlation Chart
The statistical analysis conducted on geographies consisting of 347,782,642 people shows a substantial positive correlation between the proportion of Immigrants from Russia and percentage of population currently divorced or separated in the United States with a correlation coefficient (R) of 0.508 and weighted average of 11.3%. Similarly, the statistical analysis conducted on geographies consisting of 60,872,098 people shows a mild positive correlation between the proportion of Tlingit-Haida and percentage of population currently divorced or separated in the United States with a correlation coefficient (R) of 0.378 and weighted average of 13.2%, a difference of 16.2%.
Divorced or Separated Correlation Summary
| Measurement | Immigrants from Russia | Tlingit-Haida |
| Minimum | 0.20% | 1.8% |
| Maximum | 34.6% | 33.1% |
| Range | 34.4% | 31.3% |
| Mean | 12.9% | 13.8% |
| Median | 11.3% | 13.6% |
| Interquartile 25% (IQ1) | 10.1% | 9.4% |
| Interquartile 75% (IQ3) | 13.7% | 15.9% |
| Interquartile Range (IQR) | 3.5% | 6.5% |
| Standard Deviation (Sample) | 6.7% | 6.6% |
| Standard Deviation (Population) | 6.6% | 6.5% |
Similar Demographics by Divorced or Separated
Demographics Similar to Immigrants from Russia by Divorced or Separated
In terms of divorced or separated, the demographic groups most similar to Immigrants from Russia are Korean (11.3%, a difference of 0.010%), Luxembourger (11.3%, a difference of 0.010%), Immigrants from Kuwait (11.3%, a difference of 0.020%), Israeli (11.3%, a difference of 0.16%), and Sri Lankan (11.3%, a difference of 0.26%).
| Demographics | Rating | Rank | Divorced or Separated |
| Immigrants | Lithuania | 99.9 /100 | #53 | Exceptional 11.3% |
| Eastern Europeans | 99.9 /100 | #54 | Exceptional 11.3% |
| Immigrants | Yemen | 99.9 /100 | #55 | Exceptional 11.3% |
| Immigrants | Philippines | 99.9 /100 | #56 | Exceptional 11.3% |
| Immigrants | Vietnam | 99.9 /100 | #57 | Exceptional 11.3% |
| Sri Lankans | 99.9 /100 | #58 | Exceptional 11.3% |
| Israelis | 99.9 /100 | #59 | Exceptional 11.3% |
| Immigrants | Russia | 99.9 /100 | #60 | Exceptional 11.3% |
| Koreans | 99.9 /100 | #61 | Exceptional 11.3% |
| Luxembourgers | 99.9 /100 | #62 | Exceptional 11.3% |
| Immigrants | Kuwait | 99.9 /100 | #63 | Exceptional 11.3% |
| Macedonians | 99.8 /100 | #64 | Exceptional 11.4% |
| Immigrants | South Eastern Asia | 99.8 /100 | #65 | Exceptional 11.4% |
| Inupiat | 99.8 /100 | #66 | Exceptional 11.4% |
| Immigrants | Syria | 99.7 /100 | #67 | Exceptional 11.4% |
Demographics Similar to Tlingit-Haida by Divorced or Separated
In terms of divorced or separated, the demographic groups most similar to Tlingit-Haida are Chippewa (13.2%, a difference of 0.16%), Hopi (13.2%, a difference of 0.22%), French American Indian (13.2%, a difference of 0.25%), Ottawa (13.2%, a difference of 0.34%), and Cape Verdean (13.1%, a difference of 0.35%).
| Demographics | Rating | Rank | Divorced or Separated |
| Immigrants | Jamaica | 0.0 /100 | #299 | Tragic 13.0% |
| Immigrants | Cabo Verde | 0.0 /100 | #300 | Tragic 13.1% |
| Alaskan Athabascans | 0.0 /100 | #301 | Tragic 13.1% |
| Immigrants | Venezuela | 0.0 /100 | #302 | Tragic 13.1% |
| Cape Verdeans | 0.0 /100 | #303 | Tragic 13.1% |
| Hopi | 0.0 /100 | #304 | Tragic 13.2% |
| Chippewa | 0.0 /100 | #305 | Tragic 13.2% |
| Tlingit-Haida | 0.0 /100 | #306 | Tragic 13.2% |
| French American Indians | 0.0 /100 | #307 | Tragic 13.2% |
| Ottawa | 0.0 /100 | #308 | Tragic 13.2% |
| Americans | 0.0 /100 | #309 | Tragic 13.2% |
| Africans | 0.0 /100 | #310 | Tragic 13.2% |
| Sioux | 0.0 /100 | #311 | Tragic 13.2% |
| Blackfeet | 0.0 /100 | #312 | Tragic 13.3% |
| Immigrants | Nicaragua | 0.0 /100 | #313 | Tragic 13.3% |