Immigrants from Romania vs South African Single Mother Households
COMPARE
Immigrants from Romania
South African
Single Mother Households
Single Mother Households Comparison
Immigrants from Romania
South Africans
5.5%
SINGLE MOTHER HOUSEHOLDS
99.0/ 100
METRIC RATING
56th/ 347
METRIC RANK
5.8%
SINGLE MOTHER HOUSEHOLDS
94.1/ 100
METRIC RATING
119th/ 347
METRIC RANK
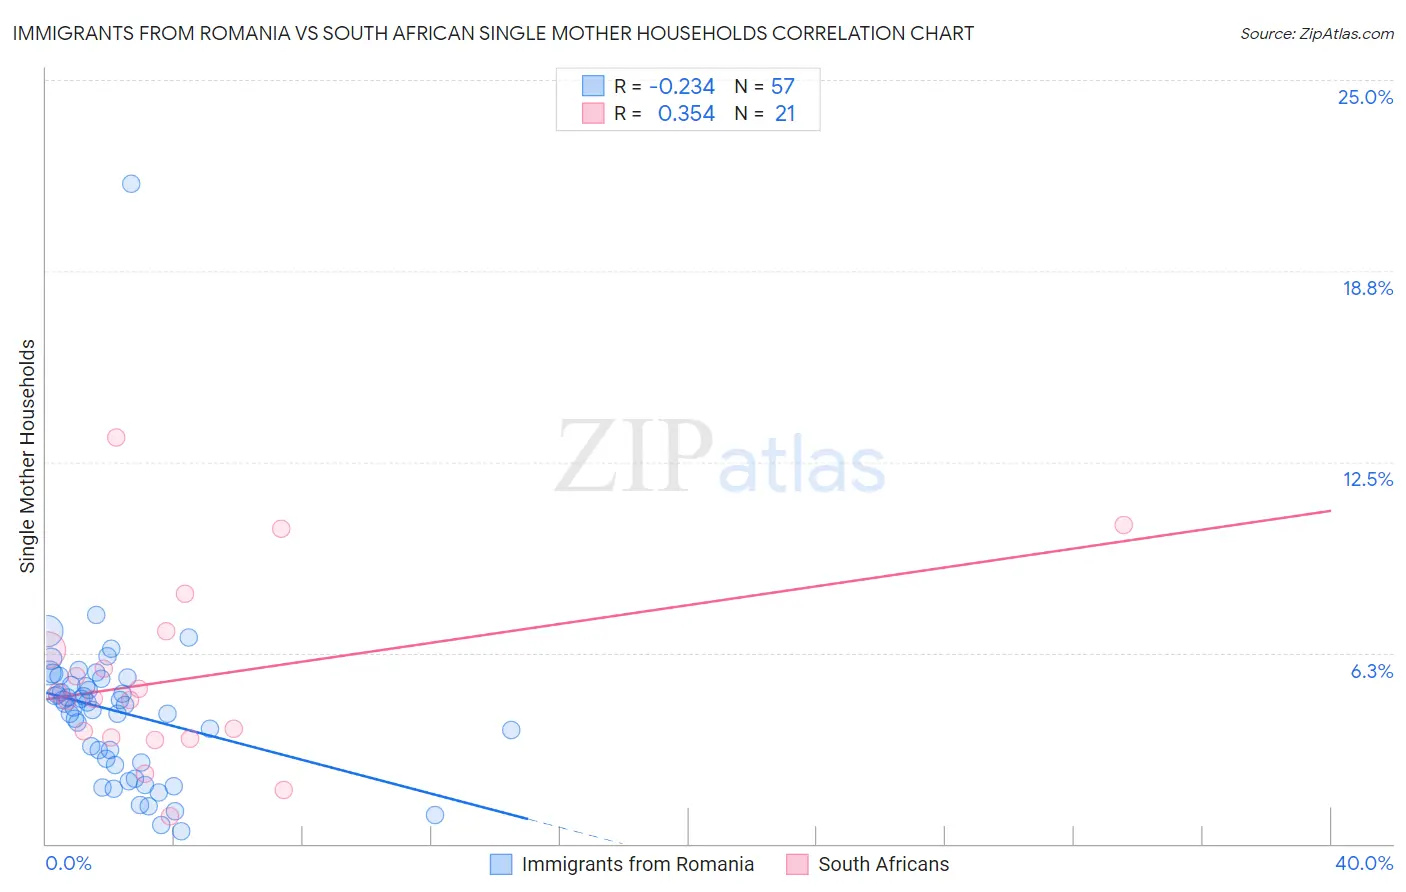
Immigrants from Romania vs South African Single Mother Households Correlation Chart
The statistical analysis conducted on geographies consisting of 256,535,689 people shows a weak negative correlation between the proportion of Immigrants from Romania and percentage of single mother households in the United States with a correlation coefficient (R) of -0.234 and weighted average of 5.5%. Similarly, the statistical analysis conducted on geographies consisting of 182,301,498 people shows a mild positive correlation between the proportion of South Africans and percentage of single mother households in the United States with a correlation coefficient (R) of 0.354 and weighted average of 5.8%, a difference of 5.8%.
Single Mother Households Correlation Summary
| Measurement | Immigrants from Romania | South African |
| Minimum | 0.41% | 0.92% |
| Maximum | 21.6% | 13.3% |
| Range | 21.2% | 12.4% |
| Mean | 4.3% | 5.4% |
| Median | 4.6% | 4.8% |
| Interquartile 25% (IQ1) | 2.6% | 3.5% |
| Interquartile 75% (IQ3) | 5.3% | 6.7% |
| Interquartile Range (IQR) | 2.7% | 3.2% |
| Standard Deviation (Sample) | 2.9% | 3.0% |
| Standard Deviation (Population) | 2.9% | 3.0% |
Similar Demographics by Single Mother Households
Demographics Similar to Immigrants from Romania by Single Mother Households
In terms of single mother households, the demographic groups most similar to Immigrants from Romania are Immigrants from Denmark (5.5%, a difference of 0.070%), Immigrants from Europe (5.5%, a difference of 0.080%), Immigrants from Lebanon (5.5%, a difference of 0.24%), Immigrants from Russia (5.5%, a difference of 0.26%), and Danish (5.5%, a difference of 0.32%).
| Demographics | Rating | Rank | Single Mother Households |
| Immigrants | Latvia | 99.2 /100 | #49 | Exceptional 5.5% |
| Immigrants | Scotland | 99.2 /100 | #50 | Exceptional 5.5% |
| Immigrants | Belarus | 99.2 /100 | #51 | Exceptional 5.5% |
| Swedes | 99.1 /100 | #52 | Exceptional 5.5% |
| Immigrants | Russia | 99.1 /100 | #53 | Exceptional 5.5% |
| Immigrants | Lebanon | 99.1 /100 | #54 | Exceptional 5.5% |
| Immigrants | Denmark | 99.1 /100 | #55 | Exceptional 5.5% |
| Immigrants | Romania | 99.0 /100 | #56 | Exceptional 5.5% |
| Immigrants | Europe | 99.0 /100 | #57 | Exceptional 5.5% |
| Danes | 98.9 /100 | #58 | Exceptional 5.5% |
| Luxembourgers | 98.7 /100 | #59 | Exceptional 5.6% |
| Immigrants | Norway | 98.7 /100 | #60 | Exceptional 5.6% |
| Australians | 98.7 /100 | #61 | Exceptional 5.6% |
| Poles | 98.6 /100 | #62 | Exceptional 5.6% |
| Immigrants | North Macedonia | 98.6 /100 | #63 | Exceptional 5.6% |
Demographics Similar to South Africans by Single Mother Households
In terms of single mother households, the demographic groups most similar to South Africans are Laotian (5.8%, a difference of 0.11%), Tongan (5.8%, a difference of 0.19%), Argentinean (5.8%, a difference of 0.22%), Bolivian (5.8%, a difference of 0.28%), and Belgian (5.8%, a difference of 0.30%).
| Demographics | Rating | Rank | Single Mother Households |
| Immigrants | Kuwait | 95.4 /100 | #112 | Exceptional 5.8% |
| Mongolians | 95.3 /100 | #113 | Exceptional 5.8% |
| Dutch | 95.1 /100 | #114 | Exceptional 5.8% |
| Irish | 94.8 /100 | #115 | Exceptional 5.8% |
| Pennsylvania Germans | 94.7 /100 | #116 | Exceptional 5.8% |
| Bolivians | 94.6 /100 | #117 | Exceptional 5.8% |
| Laotians | 94.3 /100 | #118 | Exceptional 5.8% |
| South Africans | 94.1 /100 | #119 | Exceptional 5.8% |
| Tongans | 93.7 /100 | #120 | Exceptional 5.8% |
| Argentineans | 93.7 /100 | #121 | Exceptional 5.8% |
| Belgians | 93.5 /100 | #122 | Exceptional 5.8% |
| Immigrants | Uzbekistan | 93.4 /100 | #123 | Exceptional 5.9% |
| Immigrants | Argentina | 93.2 /100 | #124 | Exceptional 5.9% |
| Slavs | 92.9 /100 | #125 | Exceptional 5.9% |
| Welsh | 92.8 /100 | #126 | Exceptional 5.9% |