Immigrants from Romania vs South African In Labor Force | Age 20-24
COMPARE
Immigrants from Romania
South African
In Labor Force | Age 20-24
In Labor Force | Age 20-24 Comparison
Immigrants from Romania
South Africans
75.2%
IN LABOR FORCE | AGE 20-24
64.6/ 100
METRIC RATING
162nd/ 347
METRIC RANK
75.0%
IN LABOR FORCE | AGE 20-24
50.0/ 100
METRIC RATING
174th/ 347
METRIC RANK
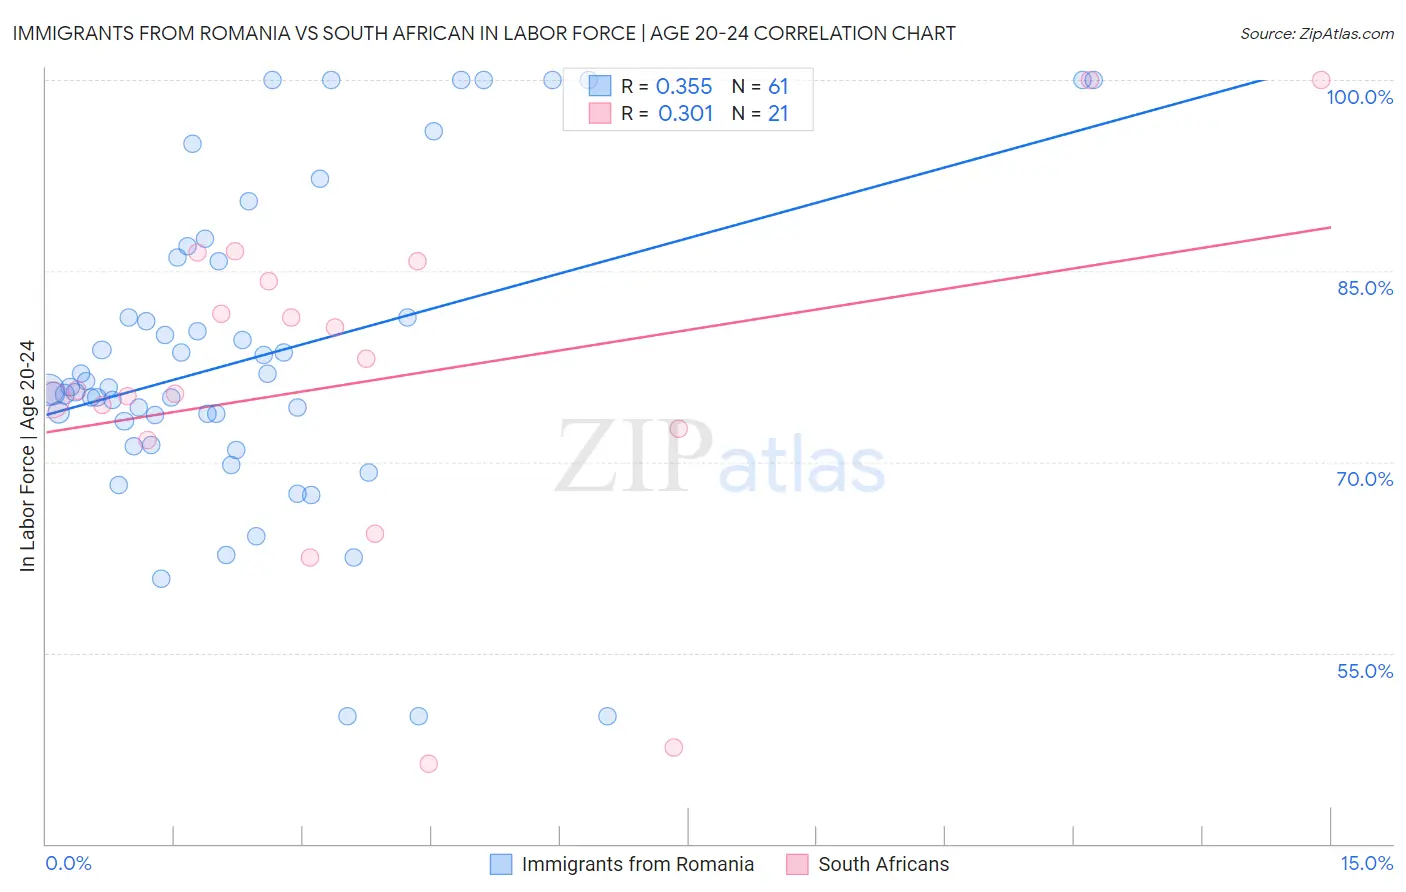
Immigrants from Romania vs South African In Labor Force | Age 20-24 Correlation Chart
The statistical analysis conducted on geographies consisting of 256,948,793 people shows a mild positive correlation between the proportion of Immigrants from Romania and labor force participation rate among population between the ages 20 and 24 in the United States with a correlation coefficient (R) of 0.355 and weighted average of 75.2%. Similarly, the statistical analysis conducted on geographies consisting of 182,529,469 people shows a mild positive correlation between the proportion of South Africans and labor force participation rate among population between the ages 20 and 24 in the United States with a correlation coefficient (R) of 0.301 and weighted average of 75.0%, a difference of 0.22%.
In Labor Force | Age 20-24 Correlation Summary
| Measurement | Immigrants from Romania | South African |
| Minimum | 50.0% | 46.3% |
| Maximum | 100.0% | 100.0% |
| Range | 50.0% | 53.7% |
| Mean | 78.3% | 76.4% |
| Median | 75.9% | 75.6% |
| Interquartile 25% (IQ1) | 72.2% | 72.2% |
| Interquartile 75% (IQ3) | 85.9% | 85.0% |
| Interquartile Range (IQR) | 13.7% | 12.8% |
| Standard Deviation (Sample) | 12.4% | 13.5% |
| Standard Deviation (Population) | 12.3% | 13.2% |
Demographics Similar to Immigrants from Romania and South Africans by In Labor Force | Age 20-24
In terms of in labor force | age 20-24, the demographic groups most similar to Immigrants from Romania are New Zealander (75.2%, a difference of 0.010%), Costa Rican (75.2%, a difference of 0.010%), Bolivian (75.2%, a difference of 0.010%), Afghan (75.2%, a difference of 0.020%), and Cambodian (75.2%, a difference of 0.060%). Similarly, the demographic groups most similar to South Africans are Immigrants from Croatia (75.1%, a difference of 0.0%), Yakama (75.1%, a difference of 0.010%), Syrian (75.0%, a difference of 0.010%), Cajun (75.1%, a difference of 0.020%), and Central American (75.0%, a difference of 0.020%).
| Demographics | Rating | Rank | In Labor Force | Age 20-24 |
| Immigrants | Bolivia | 71.0 /100 | #158 | Good 75.3% |
| South American Indians | 69.0 /100 | #159 | Good 75.3% |
| Japanese | 68.7 /100 | #160 | Good 75.3% |
| New Zealanders | 65.4 /100 | #161 | Good 75.2% |
| Immigrants | Romania | 64.6 /100 | #162 | Good 75.2% |
| Costa Ricans | 64.2 /100 | #163 | Good 75.2% |
| Bolivians | 64.0 /100 | #164 | Good 75.2% |
| Afghans | 63.5 /100 | #165 | Good 75.2% |
| Cambodians | 60.5 /100 | #166 | Good 75.2% |
| Immigrants | South Eastern Asia | 57.5 /100 | #167 | Average 75.1% |
| Immigrants | Western Africa | 56.7 /100 | #168 | Average 75.1% |
| Immigrants | Philippines | 55.8 /100 | #169 | Average 75.1% |
| Mexicans | 52.1 /100 | #170 | Average 75.1% |
| Cajuns | 51.1 /100 | #171 | Average 75.1% |
| Yakama | 50.8 /100 | #172 | Average 75.1% |
| Immigrants | Croatia | 50.2 /100 | #173 | Average 75.1% |
| South Africans | 50.0 /100 | #174 | Average 75.0% |
| Syrians | 49.5 /100 | #175 | Average 75.0% |
| Central Americans | 48.7 /100 | #176 | Average 75.0% |
| Immigrants | Mexico | 47.8 /100 | #177 | Average 75.0% |
| Immigrants | Central America | 45.0 /100 | #178 | Average 75.0% |