Immigrants from Peru vs Delaware Currently Married
COMPARE
Immigrants from Peru
Delaware
Currently Married
Currently Married Comparison
Immigrants from Peru
Delaware
46.4%
CURRENTLY MARRIED
35.3/ 100
METRIC RATING
187th/ 347
METRIC RANK
46.9%
CURRENTLY MARRIED
64.7/ 100
METRIC RATING
163rd/ 347
METRIC RANK
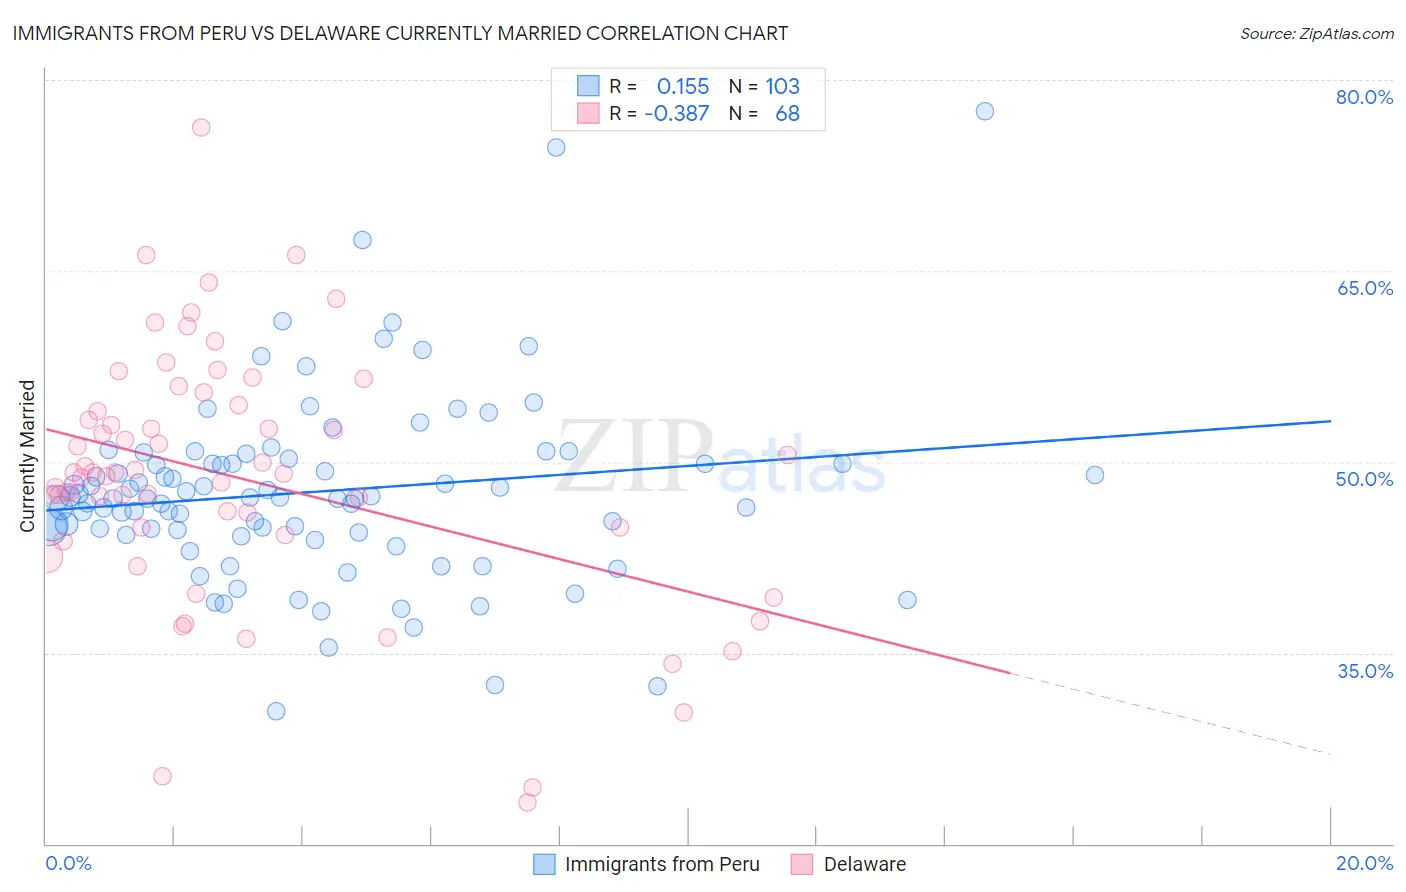
Immigrants from Peru vs Delaware Currently Married Correlation Chart
The statistical analysis conducted on geographies consisting of 328,847,084 people shows a poor positive correlation between the proportion of Immigrants from Peru and percentage of population currently married in the United States with a correlation coefficient (R) of 0.155 and weighted average of 46.4%. Similarly, the statistical analysis conducted on geographies consisting of 96,237,198 people shows a mild negative correlation between the proportion of Delaware and percentage of population currently married in the United States with a correlation coefficient (R) of -0.387 and weighted average of 46.9%, a difference of 1.1%.
Currently Married Correlation Summary
| Measurement | Immigrants from Peru | Delaware |
| Minimum | 30.4% | 23.2% |
| Maximum | 77.5% | 76.3% |
| Range | 47.1% | 53.1% |
| Mean | 47.6% | 48.7% |
| Median | 47.2% | 49.1% |
| Interquartile 25% (IQ1) | 44.5% | 44.5% |
| Interquartile 75% (IQ3) | 49.9% | 54.2% |
| Interquartile Range (IQR) | 5.4% | 9.7% |
| Standard Deviation (Sample) | 7.3% | 9.9% |
| Standard Deviation (Population) | 7.3% | 9.9% |
Similar Demographics by Currently Married
Demographics Similar to Immigrants from Peru by Currently Married
In terms of currently married, the demographic groups most similar to Immigrants from Peru are Immigrants from Chile (46.4%, a difference of 0.060%), Mongolian (46.4%, a difference of 0.090%), Colombian (46.3%, a difference of 0.14%), Brazilian (46.4%, a difference of 0.16%), and Immigrants from Northern Africa (46.5%, a difference of 0.17%).
| Demographics | Rating | Rank | Currently Married |
| Costa Ricans | 43.7 /100 | #180 | Average 46.5% |
| Ottawa | 43.0 /100 | #181 | Average 46.5% |
| Potawatomi | 41.9 /100 | #182 | Average 46.5% |
| Immigrants | Northern Africa | 39.7 /100 | #183 | Fair 46.5% |
| Brazilians | 39.3 /100 | #184 | Fair 46.4% |
| Mongolians | 37.6 /100 | #185 | Fair 46.4% |
| Immigrants | Chile | 36.8 /100 | #186 | Fair 46.4% |
| Immigrants | Peru | 35.3 /100 | #187 | Fair 46.4% |
| Colombians | 31.8 /100 | #188 | Fair 46.3% |
| Fijians | 30.3 /100 | #189 | Fair 46.3% |
| Choctaw | 29.1 /100 | #190 | Fair 46.3% |
| Immigrants | France | 27.7 /100 | #191 | Fair 46.2% |
| Soviet Union | 25.7 /100 | #192 | Fair 46.2% |
| Immigrants | Fiji | 25.0 /100 | #193 | Fair 46.2% |
| South Americans | 23.8 /100 | #194 | Fair 46.1% |
Demographics Similar to Delaware by Currently Married
In terms of currently married, the demographic groups most similar to Delaware are Immigrants from Western Asia (46.9%, a difference of 0.020%), Nonimmigrants (46.9%, a difference of 0.030%), Immigrants from Uzbekistan (46.9%, a difference of 0.050%), Immigrants from Southern Europe (46.9%, a difference of 0.050%), and Iraqi (46.9%, a difference of 0.070%).
| Demographics | Rating | Rank | Currently Married |
| Spanish | 68.1 /100 | #156 | Good 47.0% |
| Immigrants | Switzerland | 67.8 /100 | #157 | Good 46.9% |
| Cherokee | 66.8 /100 | #158 | Good 46.9% |
| Iraqis | 66.4 /100 | #159 | Good 46.9% |
| Immigrants | Uzbekistan | 66.0 /100 | #160 | Good 46.9% |
| Immigrants | Southern Europe | 65.9 /100 | #161 | Good 46.9% |
| Immigrants | Nonimmigrants | 65.4 /100 | #162 | Good 46.9% |
| Delaware | 64.7 /100 | #163 | Good 46.9% |
| Immigrants | Western Asia | 64.2 /100 | #164 | Good 46.9% |
| Samoans | 59.8 /100 | #165 | Average 46.8% |
| Immigrants | Syria | 59.3 /100 | #166 | Average 46.8% |
| Spaniards | 58.8 /100 | #167 | Average 46.8% |
| Immigrants | Afghanistan | 58.2 /100 | #168 | Average 46.8% |
| Armenians | 58.2 /100 | #169 | Average 46.8% |
| Immigrants | Latvia | 56.7 /100 | #170 | Average 46.7% |