Immigrants from Peru vs Hmong Seniors Poverty Over the Age of 75
COMPARE
Immigrants from Peru
Hmong
Seniors Poverty Over the Age of 75
Seniors Poverty Over the Age of 75 Comparison
Immigrants from Peru
Hmong
13.7%
SENIORS POVERTY OVER THE AGE OF 75
0.3/ 100
METRIC RATING
251st/ 347
METRIC RANK
12.0%
SENIORS POVERTY OVER THE AGE OF 75
70.8/ 100
METRIC RATING
144th/ 347
METRIC RANK
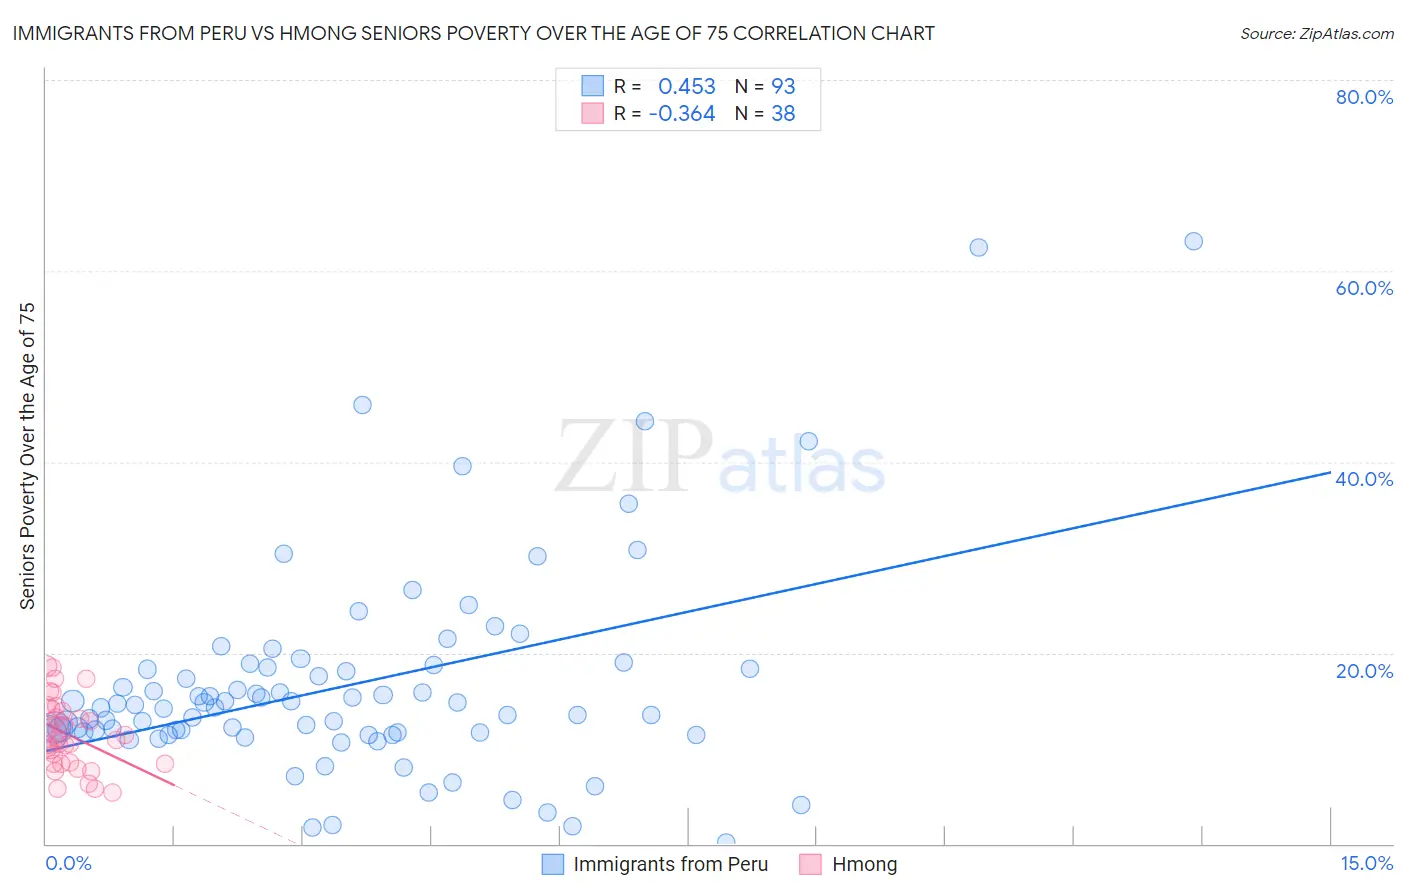
Immigrants from Peru vs Hmong Seniors Poverty Over the Age of 75 Correlation Chart
The statistical analysis conducted on geographies consisting of 326,168,143 people shows a moderate positive correlation between the proportion of Immigrants from Peru and poverty level among seniors over the age of 75 in the United States with a correlation coefficient (R) of 0.453 and weighted average of 13.7%. Similarly, the statistical analysis conducted on geographies consisting of 24,651,884 people shows a mild negative correlation between the proportion of Hmong and poverty level among seniors over the age of 75 in the United States with a correlation coefficient (R) of -0.364 and weighted average of 12.0%, a difference of 14.1%.
Seniors Poverty Over the Age of 75 Correlation Summary
| Measurement | Immigrants from Peru | Hmong |
| Minimum | 0.17% | 5.4% |
| Maximum | 63.2% | 18.6% |
| Range | 63.0% | 13.2% |
| Mean | 16.6% | 11.4% |
| Median | 14.3% | 10.9% |
| Interquartile 25% (IQ1) | 11.6% | 8.4% |
| Interquartile 75% (IQ3) | 18.4% | 13.9% |
| Interquartile Range (IQR) | 6.8% | 5.6% |
| Standard Deviation (Sample) | 11.0% | 3.6% |
| Standard Deviation (Population) | 10.9% | 3.5% |
Similar Demographics by Seniors Poverty Over the Age of 75
Demographics Similar to Immigrants from Peru by Seniors Poverty Over the Age of 75
In terms of seniors poverty over the age of 75, the demographic groups most similar to Immigrants from Peru are Immigrants from Argentina (13.7%, a difference of 0.050%), Immigrants from Spain (13.7%, a difference of 0.27%), Mexican American Indian (13.6%, a difference of 0.33%), Immigrants from Albania (13.6%, a difference of 0.34%), and African (13.6%, a difference of 0.35%).
| Demographics | Rating | Rank | Seniors Poverty Over the Age of 75 |
| Spanish Americans | 0.5 /100 | #244 | Tragic 13.5% |
| Uruguayans | 0.5 /100 | #245 | Tragic 13.5% |
| Immigrants | Cambodia | 0.4 /100 | #246 | Tragic 13.6% |
| Immigrants | Ukraine | 0.3 /100 | #247 | Tragic 13.6% |
| Africans | 0.3 /100 | #248 | Tragic 13.6% |
| Immigrants | Albania | 0.3 /100 | #249 | Tragic 13.6% |
| Mexican American Indians | 0.3 /100 | #250 | Tragic 13.6% |
| Immigrants | Peru | 0.3 /100 | #251 | Tragic 13.7% |
| Immigrants | Argentina | 0.3 /100 | #252 | Tragic 13.7% |
| Immigrants | Spain | 0.2 /100 | #253 | Tragic 13.7% |
| Blackfeet | 0.2 /100 | #254 | Tragic 13.7% |
| Immigrants | Belarus | 0.2 /100 | #255 | Tragic 13.8% |
| Inupiat | 0.1 /100 | #256 | Tragic 13.8% |
| Immigrants | Western Africa | 0.1 /100 | #257 | Tragic 13.9% |
| Immigrants | Panama | 0.1 /100 | #258 | Tragic 13.9% |
Demographics Similar to Hmong by Seniors Poverty Over the Age of 75
In terms of seniors poverty over the age of 75, the demographic groups most similar to Hmong are Immigrants from Belgium (12.0%, a difference of 0.0%), American (12.0%, a difference of 0.010%), Bangladeshi (12.0%, a difference of 0.050%), Immigrants from Laos (12.0%, a difference of 0.060%), and Immigrants from Cameroon (12.0%, a difference of 0.090%).
| Demographics | Rating | Rank | Seniors Poverty Over the Age of 75 |
| Immigrants | Moldova | 74.1 /100 | #137 | Good 11.9% |
| Immigrants | Romania | 72.6 /100 | #138 | Good 11.9% |
| Immigrants | Kenya | 72.6 /100 | #139 | Good 11.9% |
| Immigrants | Pakistan | 71.9 /100 | #140 | Good 12.0% |
| Immigrants | Cameroon | 71.7 /100 | #141 | Good 12.0% |
| Immigrants | Laos | 71.5 /100 | #142 | Good 12.0% |
| Americans | 71.0 /100 | #143 | Good 12.0% |
| Hmong | 70.8 /100 | #144 | Good 12.0% |
| Immigrants | Belgium | 70.8 /100 | #145 | Good 12.0% |
| Bangladeshis | 70.4 /100 | #146 | Good 12.0% |
| Immigrants | Latvia | 69.1 /100 | #147 | Good 12.0% |
| Immigrants | Zaire | 67.6 /100 | #148 | Good 12.0% |
| Asians | 67.4 /100 | #149 | Good 12.0% |
| Cypriots | 67.3 /100 | #150 | Good 12.0% |
| Cherokee | 65.8 /100 | #151 | Good 12.0% |