Immigrants from Oceania vs Chickasaw Family Households with Children
COMPARE
Immigrants from Oceania
Chickasaw
Family Households with Children
Family Households with Children Comparison
Immigrants from Oceania
Chickasaw
28.1%
FAMILY HOUSEHOLDS WITH CHILDREN
98.8/ 100
METRIC RATING
101st/ 347
METRIC RANK
28.2%
FAMILY HOUSEHOLDS WITH CHILDREN
99.4/ 100
METRIC RATING
92nd/ 347
METRIC RANK
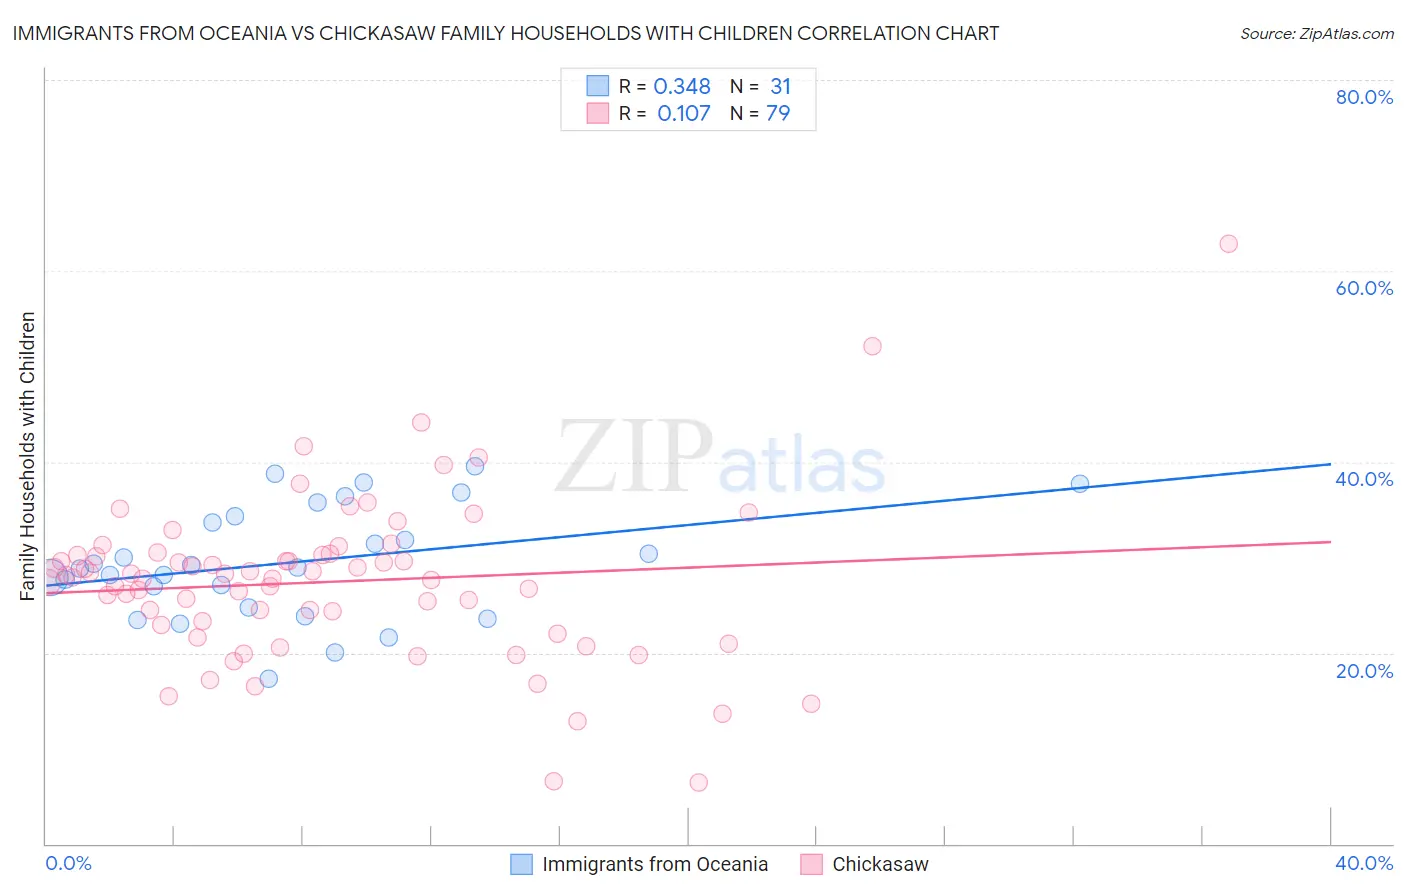
Immigrants from Oceania vs Chickasaw Family Households with Children Correlation Chart
The statistical analysis conducted on geographies consisting of 305,304,848 people shows a mild positive correlation between the proportion of Immigrants from Oceania and percentage of family households with children in the United States with a correlation coefficient (R) of 0.348 and weighted average of 28.1%. Similarly, the statistical analysis conducted on geographies consisting of 147,673,787 people shows a poor positive correlation between the proportion of Chickasaw and percentage of family households with children in the United States with a correlation coefficient (R) of 0.107 and weighted average of 28.2%, a difference of 0.38%.
Family Households with Children Correlation Summary
| Measurement | Immigrants from Oceania | Chickasaw |
| Minimum | 17.3% | 6.5% |
| Maximum | 39.5% | 62.8% |
| Range | 22.2% | 56.3% |
| Mean | 29.5% | 27.4% |
| Median | 28.9% | 27.9% |
| Interquartile 25% (IQ1) | 24.7% | 22.9% |
| Interquartile 75% (IQ3) | 34.3% | 30.3% |
| Interquartile Range (IQR) | 9.6% | 7.4% |
| Standard Deviation (Sample) | 5.8% | 8.6% |
| Standard Deviation (Population) | 5.7% | 8.5% |
Demographics Similar to Immigrants from Oceania and Chickasaw by Family Households with Children
In terms of family households with children, the demographic groups most similar to Immigrants from Oceania are Immigrants from the Azores (28.1%, a difference of 0.020%), Indonesian (28.1%, a difference of 0.020%), Immigrants from Kenya (28.1%, a difference of 0.030%), Assyrian/Chaldean/Syriac (28.1%, a difference of 0.030%), and Chilean (28.1%, a difference of 0.080%). Similarly, the demographic groups most similar to Chickasaw are Immigrants from Liberia (28.2%, a difference of 0.020%), Immigrants from Thailand (28.2%, a difference of 0.070%), Panamanian (28.2%, a difference of 0.11%), Immigrants from Colombia (28.2%, a difference of 0.15%), and Immigrants from Costa Rica (28.3%, a difference of 0.18%).
| Demographics | Rating | Rank | Family Households with Children |
| Immigrants | Western Africa | 99.6 /100 | #86 | Exceptional 28.3% |
| Colombians | 99.6 /100 | #87 | Exceptional 28.3% |
| Liberians | 99.6 /100 | #88 | Exceptional 28.3% |
| Immigrants | Costa Rica | 99.6 /100 | #89 | Exceptional 28.3% |
| Immigrants | Thailand | 99.5 /100 | #90 | Exceptional 28.2% |
| Immigrants | Liberia | 99.4 /100 | #91 | Exceptional 28.2% |
| Chickasaw | 99.4 /100 | #92 | Exceptional 28.2% |
| Panamanians | 99.3 /100 | #93 | Exceptional 28.2% |
| Immigrants | Colombia | 99.2 /100 | #94 | Exceptional 28.2% |
| Immigrants | Nicaragua | 99.1 /100 | #95 | Exceptional 28.2% |
| Ute | 99.1 /100 | #96 | Exceptional 28.2% |
| Chileans | 98.9 /100 | #97 | Exceptional 28.1% |
| Immigrants | Kenya | 98.9 /100 | #98 | Exceptional 28.1% |
| Immigrants | Azores | 98.8 /100 | #99 | Exceptional 28.1% |
| Indonesians | 98.8 /100 | #100 | Exceptional 28.1% |
| Immigrants | Oceania | 98.8 /100 | #101 | Exceptional 28.1% |
| Assyrians/Chaldeans/Syriacs | 98.7 /100 | #102 | Exceptional 28.1% |
| Palestinians | 98.5 /100 | #103 | Exceptional 28.1% |
| Sioux | 98.3 /100 | #104 | Exceptional 28.1% |
| Choctaw | 98.3 /100 | #105 | Exceptional 28.1% |
| Immigrants | South America | 98.0 /100 | #106 | Exceptional 28.0% |