Immigrants from Northern Europe vs Russian 7th Grade
COMPARE
Immigrants from Northern Europe
Russian
7th Grade
7th Grade Comparison
Immigrants from Northern Europe
Russians
96.9%
7TH GRADE
99.7/ 100
METRIC RATING
63rd/ 347
METRIC RANK
97.0%
7TH GRADE
99.8/ 100
METRIC RATING
55th/ 347
METRIC RANK
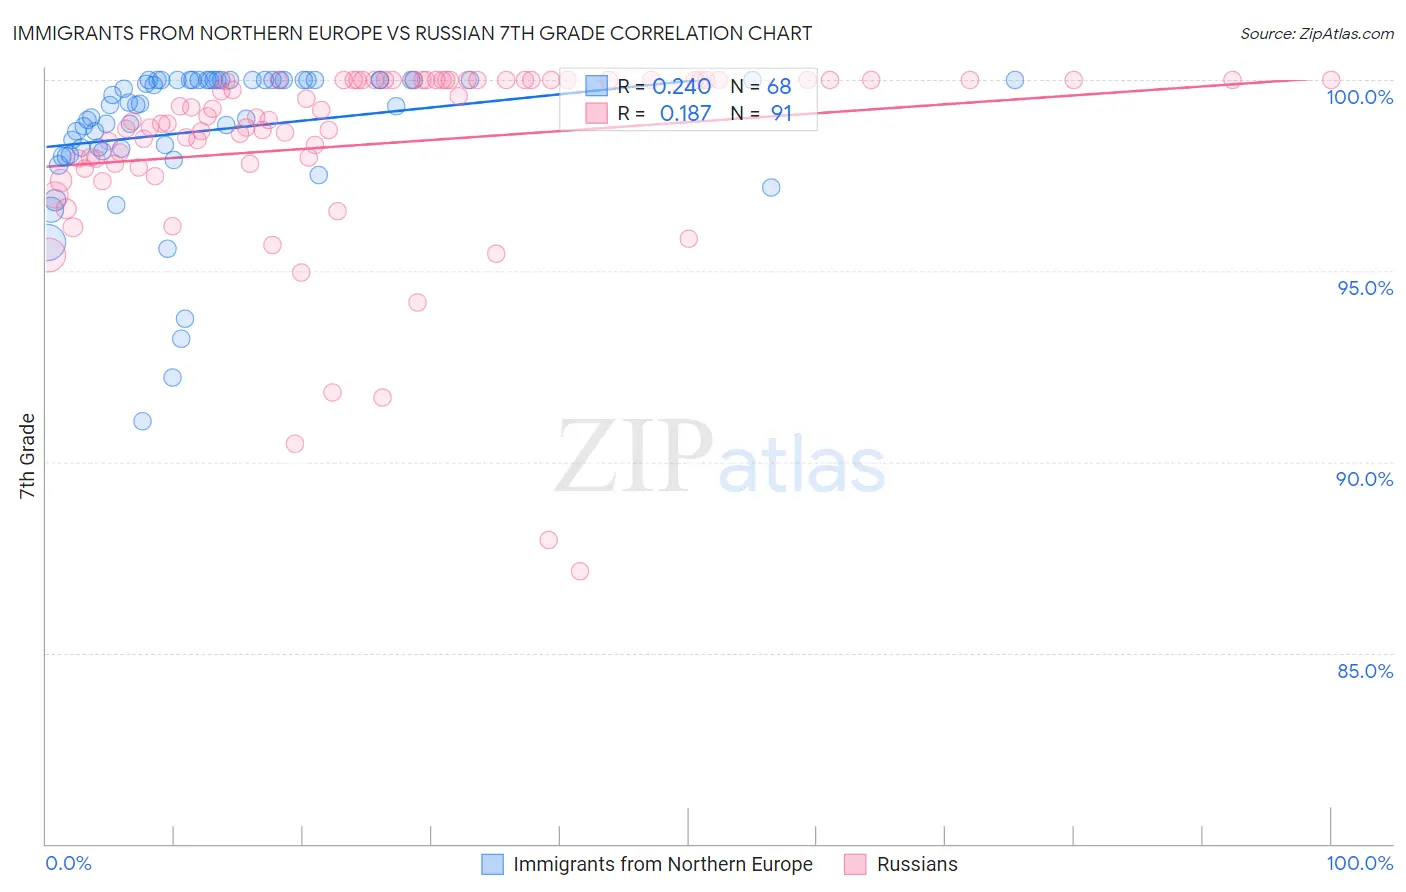
Immigrants from Northern Europe vs Russian 7th Grade Correlation Chart
The statistical analysis conducted on geographies consisting of 477,226,309 people shows a weak positive correlation between the proportion of Immigrants from Northern Europe and percentage of population with at least 7th grade education in the United States with a correlation coefficient (R) of 0.240 and weighted average of 96.9%. Similarly, the statistical analysis conducted on geographies consisting of 512,259,047 people shows a poor positive correlation between the proportion of Russians and percentage of population with at least 7th grade education in the United States with a correlation coefficient (R) of 0.187 and weighted average of 97.0%, a difference of 0.050%.
7th Grade Correlation Summary
| Measurement | Immigrants from Northern Europe | Russian |
| Minimum | 91.1% | 87.1% |
| Maximum | 100.0% | 100.0% |
| Range | 8.9% | 12.9% |
| Mean | 98.7% | 98.3% |
| Median | 99.4% | 99.0% |
| Interquartile 25% (IQ1) | 98.2% | 97.8% |
| Interquartile 75% (IQ3) | 100.0% | 100.0% |
| Interquartile Range (IQR) | 1.8% | 2.2% |
| Standard Deviation (Sample) | 1.9% | 2.5% |
| Standard Deviation (Population) | 1.9% | 2.5% |
Demographics Similar to Immigrants from Northern Europe and Russians by 7th Grade
In terms of 7th grade, the demographic groups most similar to Immigrants from Northern Europe are Immigrants from North America (96.9%, a difference of 0.010%), Immigrants from Austria (96.9%, a difference of 0.010%), Canadian (96.9%, a difference of 0.010%), Immigrants from Canada (96.9%, a difference of 0.020%), and Creek (96.9%, a difference of 0.020%). Similarly, the demographic groups most similar to Russians are Serbian (97.0%, a difference of 0.0%), American (97.0%, a difference of 0.0%), Australian (97.0%, a difference of 0.010%), White/Caucasian (97.0%, a difference of 0.020%), and Macedonian (97.0%, a difference of 0.020%).
| Demographics | Rating | Rank | 7th Grade |
| Slavs | 99.9 /100 | #49 | Exceptional 97.1% |
| Immigrants | Scotland | 99.9 /100 | #50 | Exceptional 97.1% |
| Estonians | 99.9 /100 | #51 | Exceptional 97.0% |
| Greeks | 99.9 /100 | #52 | Exceptional 97.0% |
| Austrians | 99.8 /100 | #53 | Exceptional 97.0% |
| Australians | 99.8 /100 | #54 | Exceptional 97.0% |
| Russians | 99.8 /100 | #55 | Exceptional 97.0% |
| Serbians | 99.8 /100 | #56 | Exceptional 97.0% |
| Americans | 99.8 /100 | #57 | Exceptional 97.0% |
| Whites/Caucasians | 99.8 /100 | #58 | Exceptional 97.0% |
| Macedonians | 99.8 /100 | #59 | Exceptional 97.0% |
| Immigrants | Canada | 99.8 /100 | #60 | Exceptional 96.9% |
| Creek | 99.8 /100 | #61 | Exceptional 96.9% |
| Immigrants | North America | 99.8 /100 | #62 | Exceptional 96.9% |
| Immigrants | Northern Europe | 99.7 /100 | #63 | Exceptional 96.9% |
| Immigrants | Austria | 99.7 /100 | #64 | Exceptional 96.9% |
| Canadians | 99.7 /100 | #65 | Exceptional 96.9% |
| Ukrainians | 99.7 /100 | #66 | Exceptional 96.9% |
| Native Hawaiians | 99.7 /100 | #67 | Exceptional 96.9% |
| Immigrants | India | 99.6 /100 | #68 | Exceptional 96.9% |
| Iranians | 99.6 /100 | #69 | Exceptional 96.8% |