Eastern European vs Guamanian/Chamorro Family Households
COMPARE
Eastern European
Guamanian/Chamorro
Family Households
Family Households Comparison
Eastern Europeans
Guamanians/Chamorros
63.4%
FAMILY HOUSEHOLDS
1.6/ 100
METRIC RATING
244th/ 347
METRIC RANK
66.6%
FAMILY HOUSEHOLDS
100.0/ 100
METRIC RATING
40th/ 347
METRIC RANK
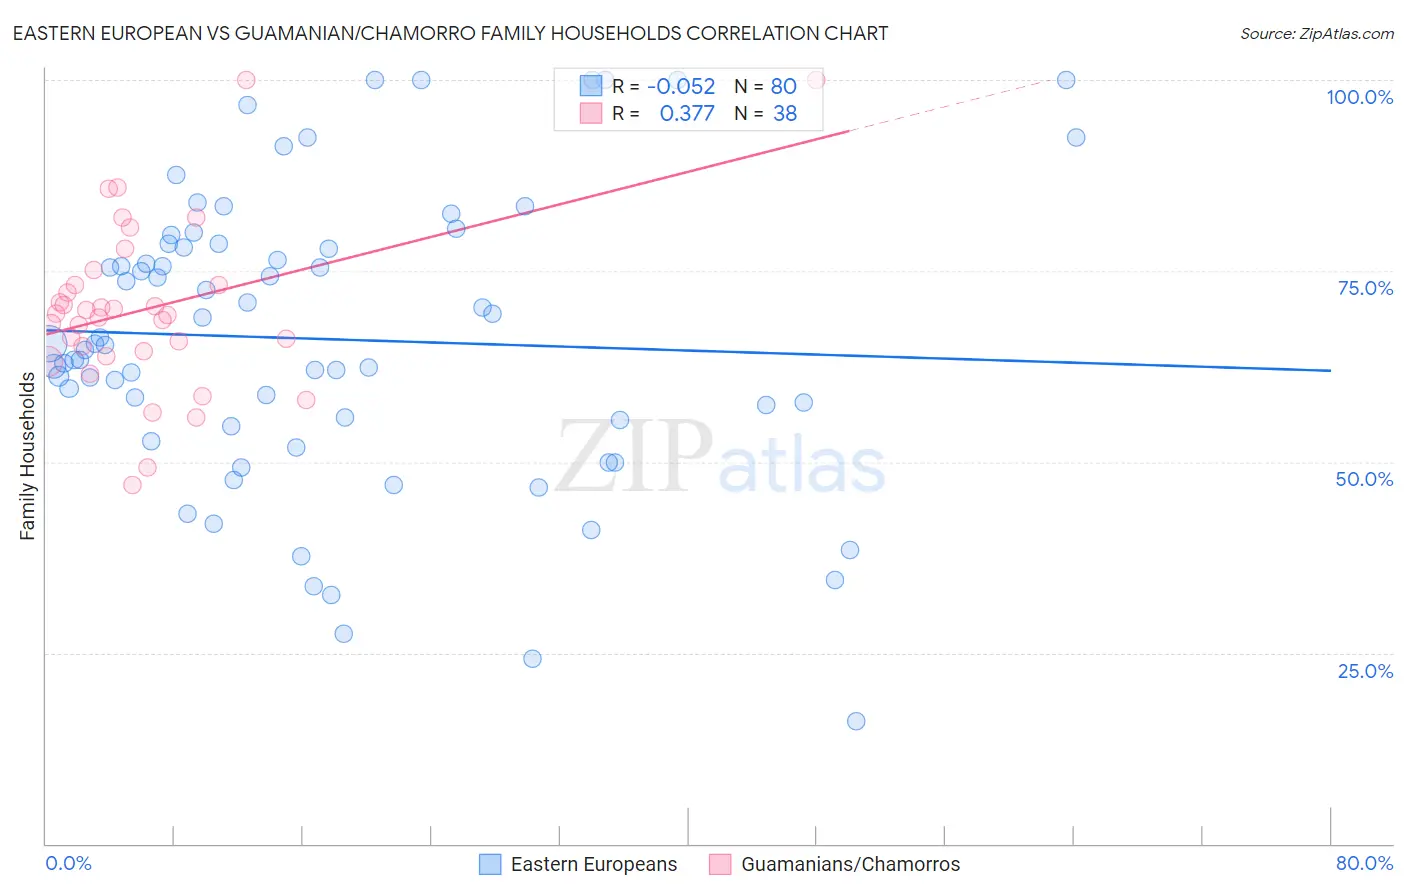
Eastern European vs Guamanian/Chamorro Family Households Correlation Chart
The statistical analysis conducted on geographies consisting of 460,961,186 people shows a slight negative correlation between the proportion of Eastern Europeans and percentage of family households in the United States with a correlation coefficient (R) of -0.052 and weighted average of 63.4%. Similarly, the statistical analysis conducted on geographies consisting of 221,865,945 people shows a mild positive correlation between the proportion of Guamanians/Chamorros and percentage of family households in the United States with a correlation coefficient (R) of 0.377 and weighted average of 66.6%, a difference of 5.0%.
Family Households Correlation Summary
| Measurement | Eastern European | Guamanian/Chamorro |
| Minimum | 16.0% | 47.0% |
| Maximum | 100.0% | 100.0% |
| Range | 84.0% | 53.0% |
| Mean | 66.1% | 70.1% |
| Median | 65.3% | 69.3% |
| Interquartile 25% (IQ1) | 55.1% | 64.4% |
| Interquartile 75% (IQ3) | 78.3% | 73.2% |
| Interquartile Range (IQR) | 23.2% | 8.8% |
| Standard Deviation (Sample) | 19.1% | 11.3% |
| Standard Deviation (Population) | 19.0% | 11.1% |
Similar Demographics by Family Households
Demographics Similar to Eastern Europeans by Family Households
In terms of family households, the demographic groups most similar to Eastern Europeans are Immigrants from Dominica (63.4%, a difference of 0.0%), Immigrants from Ghana (63.4%, a difference of 0.020%), Immigrants from Czechoslovakia (63.4%, a difference of 0.030%), Immigrants from Uzbekistan (63.4%, a difference of 0.030%), and Immigrants from Israel (63.4%, a difference of 0.040%).
| Demographics | Rating | Rank | Family Households |
| Comanche | 2.1 /100 | #237 | Tragic 63.5% |
| Immigrants | Zimbabwe | 2.0 /100 | #238 | Tragic 63.5% |
| Aleuts | 1.9 /100 | #239 | Tragic 63.4% |
| South Africans | 1.9 /100 | #240 | Tragic 63.4% |
| Immigrants | St. Vincent and the Grenadines | 1.9 /100 | #241 | Tragic 63.4% |
| Immigrants | Israel | 1.8 /100 | #242 | Tragic 63.4% |
| Immigrants | Czechoslovakia | 1.8 /100 | #243 | Tragic 63.4% |
| Eastern Europeans | 1.6 /100 | #244 | Tragic 63.4% |
| Immigrants | Dominica | 1.6 /100 | #245 | Tragic 63.4% |
| Immigrants | Ghana | 1.6 /100 | #246 | Tragic 63.4% |
| Immigrants | Uzbekistan | 1.5 /100 | #247 | Tragic 63.4% |
| Dominicans | 1.5 /100 | #248 | Tragic 63.4% |
| Russians | 1.4 /100 | #249 | Tragic 63.4% |
| Immigrants | Japan | 1.4 /100 | #250 | Tragic 63.4% |
| Taiwanese | 1.2 /100 | #251 | Tragic 63.3% |
Demographics Similar to Guamanians/Chamorros by Family Households
In terms of family households, the demographic groups most similar to Guamanians/Chamorros are Immigrants from Bolivia (66.6%, a difference of 0.030%), Menominee (66.5%, a difference of 0.090%), Apache (66.5%, a difference of 0.10%), Asian (66.5%, a difference of 0.15%), and Venezuelan (66.5%, a difference of 0.17%).
| Demographics | Rating | Rank | Family Households |
| Salvadorans | 100.0 /100 | #33 | Exceptional 67.2% |
| Thais | 100.0 /100 | #34 | Exceptional 67.2% |
| Tohono O'odham | 100.0 /100 | #35 | Exceptional 67.1% |
| Peruvians | 100.0 /100 | #36 | Exceptional 67.1% |
| Tsimshian | 100.0 /100 | #37 | Exceptional 67.1% |
| Mexican American Indians | 100.0 /100 | #38 | Exceptional 67.0% |
| Immigrants | El Salvador | 100.0 /100 | #39 | Exceptional 67.0% |
| Guamanians/Chamorros | 100.0 /100 | #40 | Exceptional 66.6% |
| Immigrants | Bolivia | 100.0 /100 | #41 | Exceptional 66.6% |
| Menominee | 100.0 /100 | #42 | Exceptional 66.5% |
| Apache | 100.0 /100 | #43 | Exceptional 66.5% |
| Asians | 100.0 /100 | #44 | Exceptional 66.5% |
| Venezuelans | 100.0 /100 | #45 | Exceptional 66.5% |
| Arapaho | 100.0 /100 | #46 | Exceptional 66.5% |
| Bolivians | 100.0 /100 | #47 | Exceptional 66.5% |