Immigrants from Northern Europe vs Scotch-Irish Average Family Size
COMPARE
Immigrants from Northern Europe
Scotch-Irish
Average Family Size
Average Family Size Comparison
Immigrants from Northern Europe
Scotch-Irish
3.13
AVERAGE FAMILY SIZE
0.1/ 100
METRIC RATING
311th/ 347
METRIC RANK
3.11
AVERAGE FAMILY SIZE
0.0/ 100
METRIC RATING
331st/ 347
METRIC RANK
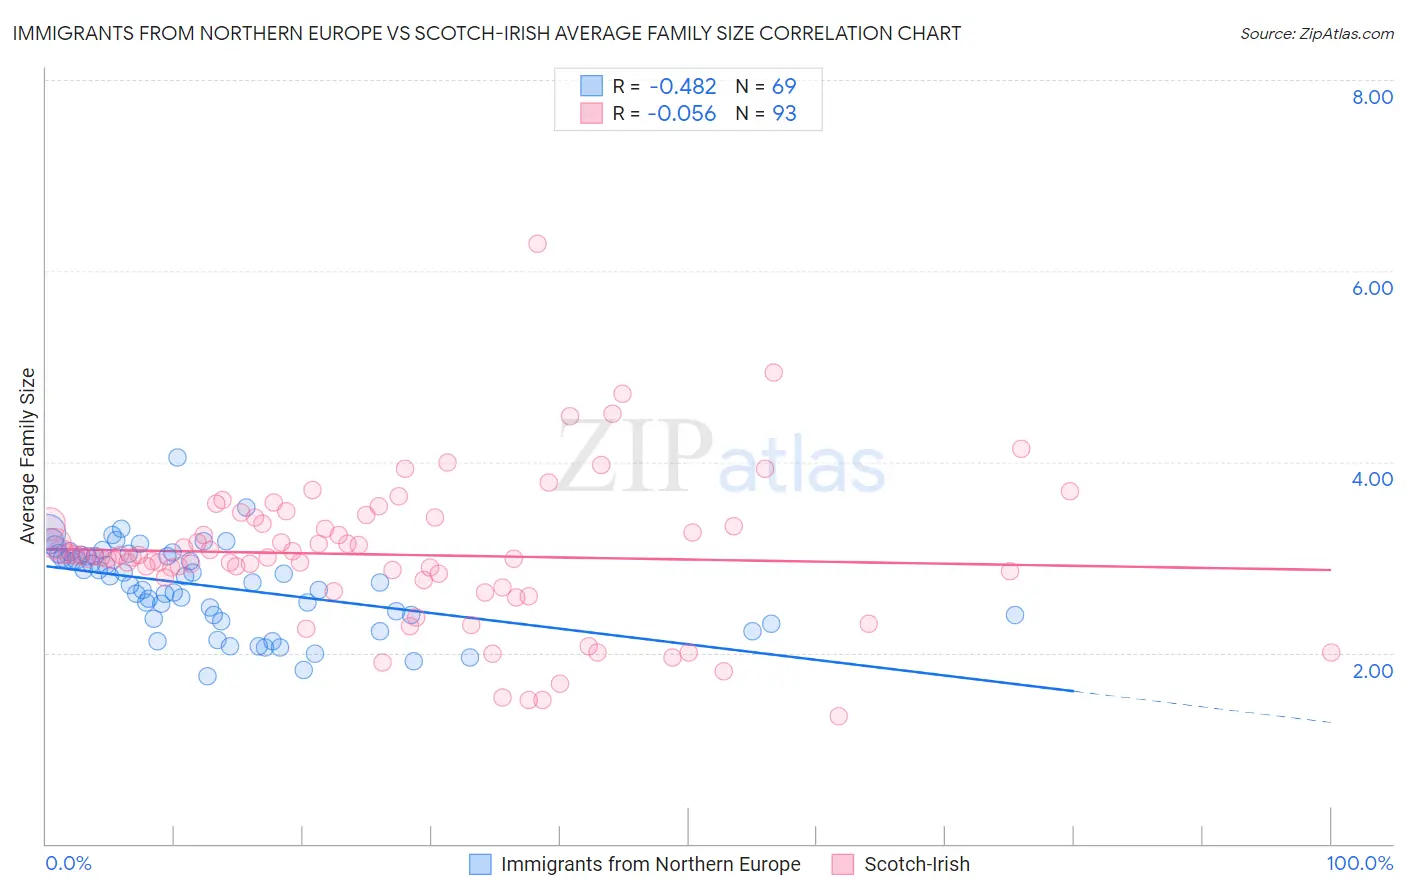
Immigrants from Northern Europe vs Scotch-Irish Average Family Size Correlation Chart
The statistical analysis conducted on geographies consisting of 476,950,566 people shows a moderate negative correlation between the proportion of Immigrants from Northern Europe and average family size in the United States with a correlation coefficient (R) of -0.482 and weighted average of 3.13. Similarly, the statistical analysis conducted on geographies consisting of 548,372,805 people shows a slight negative correlation between the proportion of Scotch-Irish and average family size in the United States with a correlation coefficient (R) of -0.056 and weighted average of 3.11, a difference of 0.68%.
Average Family Size Correlation Summary
| Measurement | Immigrants from Northern Europe | Scotch-Irish |
| Minimum | 1.76 | 1.34 |
| Maximum | 4.05 | 6.29 |
| Range | 2.29 | 4.95 |
| Mean | 2.69 | 3.03 |
| Median | 2.74 | 3.00 |
| Interquartile 25% (IQ1) | 2.37 | 2.73 |
| Interquartile 75% (IQ3) | 3.02 | 3.38 |
| Interquartile Range (IQR) | 0.65 | 0.65 |
| Standard Deviation (Sample) | 0.45 | 0.77 |
| Standard Deviation (Population) | 0.45 | 0.77 |
Demographics Similar to Immigrants from Northern Europe and Scotch-Irish by Average Family Size
In terms of average family size, the demographic groups most similar to Immigrants from Northern Europe are Immigrants from Australia (3.13, a difference of 0.020%), Bulgarian (3.13, a difference of 0.030%), Russian (3.12, a difference of 0.070%), Immigrants from Scotland (3.12, a difference of 0.090%), and Serbian (3.12, a difference of 0.17%). Similarly, the demographic groups most similar to Scotch-Irish are Latvian (3.11, a difference of 0.0%), Belgian (3.11, a difference of 0.060%), Dutch (3.11, a difference of 0.12%), Czech (3.11, a difference of 0.12%), and Ottawa (3.11, a difference of 0.13%).
| Demographics | Rating | Rank | Average Family Size |
| Immigrants | Northern Europe | 0.1 /100 | #311 | Tragic 3.13 |
| Immigrants | Australia | 0.1 /100 | #312 | Tragic 3.13 |
| Bulgarians | 0.1 /100 | #313 | Tragic 3.13 |
| Russians | 0.1 /100 | #314 | Tragic 3.12 |
| Immigrants | Scotland | 0.1 /100 | #315 | Tragic 3.12 |
| Serbians | 0.1 /100 | #316 | Tragic 3.12 |
| Italians | 0.1 /100 | #317 | Tragic 3.12 |
| Eastern Europeans | 0.1 /100 | #318 | Tragic 3.12 |
| Welsh | 0.1 /100 | #319 | Tragic 3.12 |
| Immigrants | North America | 0.0 /100 | #320 | Tragic 3.12 |
| Immigrants | Austria | 0.0 /100 | #321 | Tragic 3.12 |
| Immigrants | Canada | 0.0 /100 | #322 | Tragic 3.12 |
| Soviet Union | 0.0 /100 | #323 | Tragic 3.11 |
| Celtics | 0.0 /100 | #324 | Tragic 3.11 |
| English | 0.0 /100 | #325 | Tragic 3.11 |
| Ottawa | 0.0 /100 | #326 | Tragic 3.11 |
| Dutch | 0.0 /100 | #327 | Tragic 3.11 |
| Czechs | 0.0 /100 | #328 | Tragic 3.11 |
| Belgians | 0.0 /100 | #329 | Tragic 3.11 |
| Latvians | 0.0 /100 | #330 | Tragic 3.11 |
| Scotch-Irish | 0.0 /100 | #331 | Tragic 3.11 |