Immigrants from Northern Europe vs British Average Family Size
COMPARE
Immigrants from Northern Europe
British
Average Family Size
Average Family Size Comparison
Immigrants from Northern Europe
British
3.13
AVERAGE FAMILY SIZE
0.1/ 100
METRIC RATING
311th/ 347
METRIC RANK
3.13
AVERAGE FAMILY SIZE
0.2/ 100
METRIC RATING
303rd/ 347
METRIC RANK
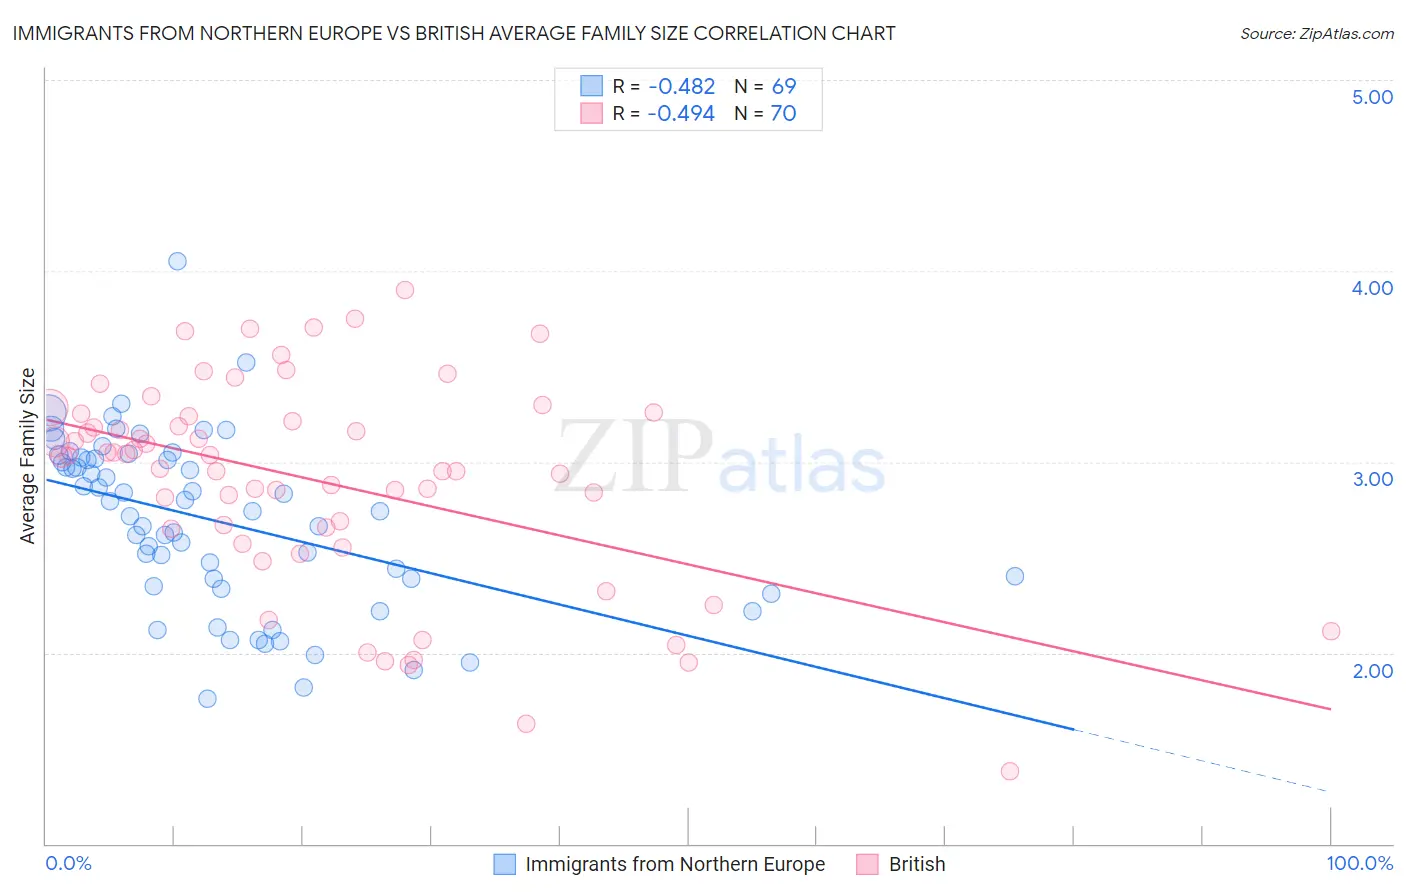
Immigrants from Northern Europe vs British Average Family Size Correlation Chart
The statistical analysis conducted on geographies consisting of 476,950,566 people shows a moderate negative correlation between the proportion of Immigrants from Northern Europe and average family size in the United States with a correlation coefficient (R) of -0.482 and weighted average of 3.13. Similarly, the statistical analysis conducted on geographies consisting of 531,009,581 people shows a moderate negative correlation between the proportion of British and average family size in the United States with a correlation coefficient (R) of -0.494 and weighted average of 3.13, a difference of 0.24%.
Average Family Size Correlation Summary
| Measurement | Immigrants from Northern Europe | British |
| Minimum | 1.76 | 1.38 |
| Maximum | 4.05 | 3.90 |
| Range | 2.29 | 2.52 |
| Mean | 2.69 | 2.90 |
| Median | 2.74 | 3.03 |
| Interquartile 25% (IQ1) | 2.37 | 2.65 |
| Interquartile 75% (IQ3) | 3.02 | 3.24 |
| Interquartile Range (IQR) | 0.65 | 0.59 |
| Standard Deviation (Sample) | 0.45 | 0.54 |
| Standard Deviation (Population) | 0.45 | 0.54 |
Demographics Similar to Immigrants from Northern Europe and British by Average Family Size
In terms of average family size, the demographic groups most similar to Immigrants from Northern Europe are Immigrants from Australia (3.13, a difference of 0.020%), Bulgarian (3.13, a difference of 0.030%), Czechoslovakian (3.13, a difference of 0.040%), Northern European (3.13, a difference of 0.060%), and Slavic (3.13, a difference of 0.070%). Similarly, the demographic groups most similar to British are Macedonian (3.13, a difference of 0.010%), Immigrants from Latvia (3.13, a difference of 0.010%), Immigrants from Switzerland (3.13, a difference of 0.020%), Australian (3.13, a difference of 0.050%), and Immigrants from Sweden (3.14, a difference of 0.080%).
| Demographics | Rating | Rank | Average Family Size |
| Immigrants | Western Europe | 0.2 /100 | #297 | Tragic 3.14 |
| Colville | 0.2 /100 | #298 | Tragic 3.14 |
| Canadians | 0.2 /100 | #299 | Tragic 3.14 |
| Immigrants | Sweden | 0.2 /100 | #300 | Tragic 3.14 |
| Macedonians | 0.2 /100 | #301 | Tragic 3.13 |
| Immigrants | Latvia | 0.2 /100 | #302 | Tragic 3.13 |
| British | 0.2 /100 | #303 | Tragic 3.13 |
| Immigrants | Switzerland | 0.2 /100 | #304 | Tragic 3.13 |
| Australians | 0.1 /100 | #305 | Tragic 3.13 |
| Immigrants | Ireland | 0.1 /100 | #306 | Tragic 3.13 |
| Immigrants | Serbia | 0.1 /100 | #307 | Tragic 3.13 |
| Slavs | 0.1 /100 | #308 | Tragic 3.13 |
| Northern Europeans | 0.1 /100 | #309 | Tragic 3.13 |
| Czechoslovakians | 0.1 /100 | #310 | Tragic 3.13 |
| Immigrants | Northern Europe | 0.1 /100 | #311 | Tragic 3.13 |
| Immigrants | Australia | 0.1 /100 | #312 | Tragic 3.13 |
| Bulgarians | 0.1 /100 | #313 | Tragic 3.13 |
| Russians | 0.1 /100 | #314 | Tragic 3.12 |
| Immigrants | Scotland | 0.1 /100 | #315 | Tragic 3.12 |
| Serbians | 0.1 /100 | #316 | Tragic 3.12 |
| Italians | 0.1 /100 | #317 | Tragic 3.12 |