Immigrants from Philippines vs Basque Family Households
COMPARE
Immigrants from Philippines
Basque
Family Households
Family Households Comparison
Immigrants from Philippines
Basques
68.3%
FAMILY HOUSEHOLDS
100.0/ 100
METRIC RATING
10th/ 347
METRIC RANK
64.7%
FAMILY HOUSEHOLDS
85.5/ 100
METRIC RATING
138th/ 347
METRIC RANK
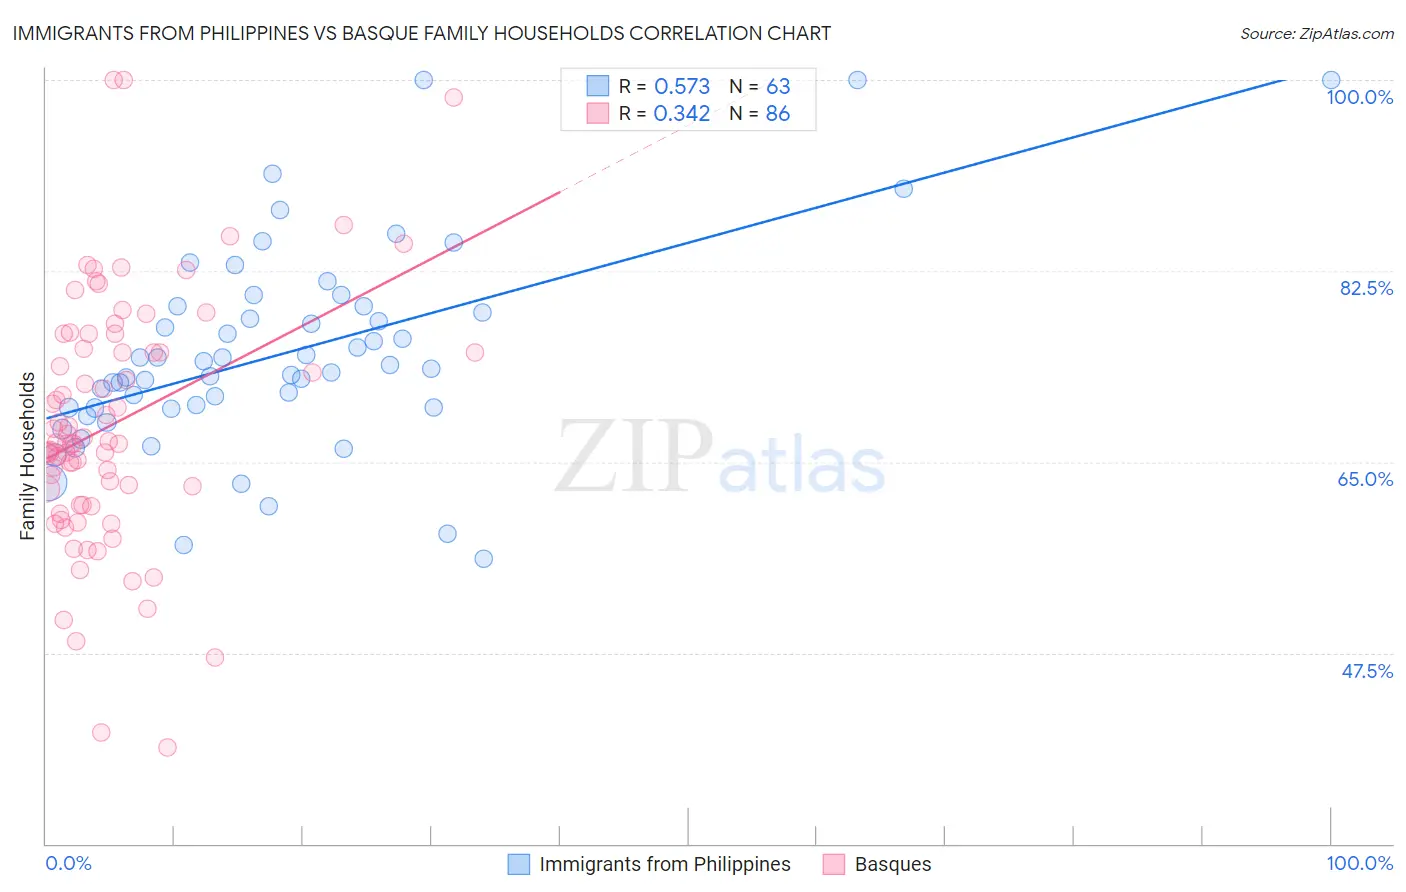
Immigrants from Philippines vs Basque Family Households Correlation Chart
The statistical analysis conducted on geographies consisting of 471,023,329 people shows a substantial positive correlation between the proportion of Immigrants from Philippines and percentage of family households in the United States with a correlation coefficient (R) of 0.573 and weighted average of 68.3%. Similarly, the statistical analysis conducted on geographies consisting of 165,752,297 people shows a mild positive correlation between the proportion of Basques and percentage of family households in the United States with a correlation coefficient (R) of 0.342 and weighted average of 64.7%, a difference of 5.6%.
Family Households Correlation Summary
| Measurement | Immigrants from Philippines | Basque |
| Minimum | 56.2% | 38.8% |
| Maximum | 100.0% | 100.0% |
| Range | 43.8% | 61.2% |
| Mean | 74.9% | 68.5% |
| Median | 73.6% | 66.7% |
| Interquartile 25% (IQ1) | 69.9% | 61.1% |
| Interquartile 75% (IQ3) | 79.3% | 75.3% |
| Interquartile Range (IQR) | 9.3% | 14.3% |
| Standard Deviation (Sample) | 9.3% | 11.5% |
| Standard Deviation (Population) | 9.2% | 11.4% |
Similar Demographics by Family Households
Demographics Similar to Immigrants from Philippines by Family Households
In terms of family households, the demographic groups most similar to Immigrants from Philippines are Native Hawaiian (68.4%, a difference of 0.070%), Immigrants from Central America (68.3%, a difference of 0.070%), Korean (68.3%, a difference of 0.10%), Pueblo (68.2%, a difference of 0.18%), and Immigrants from Cuba (68.2%, a difference of 0.19%).
| Demographics | Rating | Rank | Family Households |
| Tongans | 100.0 /100 | #3 | Exceptional 69.6% |
| Yakama | 100.0 /100 | #4 | Exceptional 69.3% |
| Yuman | 100.0 /100 | #5 | Exceptional 69.3% |
| Immigrants | Mexico | 100.0 /100 | #6 | Exceptional 69.1% |
| Mexicans | 100.0 /100 | #7 | Exceptional 69.0% |
| Immigrants | Fiji | 100.0 /100 | #8 | Exceptional 68.8% |
| Native Hawaiians | 100.0 /100 | #9 | Exceptional 68.4% |
| Immigrants | Philippines | 100.0 /100 | #10 | Exceptional 68.3% |
| Immigrants | Central America | 100.0 /100 | #11 | Exceptional 68.3% |
| Koreans | 100.0 /100 | #12 | Exceptional 68.3% |
| Pueblo | 100.0 /100 | #13 | Exceptional 68.2% |
| Immigrants | Cuba | 100.0 /100 | #14 | Exceptional 68.2% |
| Assyrians/Chaldeans/Syriacs | 100.0 /100 | #15 | Exceptional 68.2% |
| Immigrants | Vietnam | 100.0 /100 | #16 | Exceptional 68.2% |
| Chinese | 100.0 /100 | #17 | Exceptional 68.1% |
Demographics Similar to Basques by Family Households
In terms of family households, the demographic groups most similar to Basques are Immigrants from Jamaica (64.7%, a difference of 0.010%), Immigrants from Scotland (64.7%, a difference of 0.020%), Immigrants from North Macedonia (64.7%, a difference of 0.020%), Immigrants from Cameroon (64.7%, a difference of 0.020%), and Immigrants from China (64.7%, a difference of 0.030%).
| Demographics | Rating | Rank | Family Households |
| Immigrants | Nonimmigrants | 90.1 /100 | #131 | Exceptional 64.8% |
| Cajuns | 89.4 /100 | #132 | Excellent 64.8% |
| Belizeans | 89.3 /100 | #133 | Excellent 64.8% |
| Greeks | 88.1 /100 | #134 | Excellent 64.7% |
| Maltese | 87.4 /100 | #135 | Excellent 64.7% |
| Immigrants | China | 86.6 /100 | #136 | Excellent 64.7% |
| Immigrants | Scotland | 86.4 /100 | #137 | Excellent 64.7% |
| Basques | 85.5 /100 | #138 | Excellent 64.7% |
| Immigrants | Jamaica | 85.3 /100 | #139 | Excellent 64.7% |
| Immigrants | North Macedonia | 84.9 /100 | #140 | Excellent 64.7% |
| Immigrants | Cameroon | 84.8 /100 | #141 | Excellent 64.7% |
| Pakistanis | 84.0 /100 | #142 | Excellent 64.7% |
| Czechoslovakians | 82.1 /100 | #143 | Excellent 64.6% |
| South American Indians | 81.9 /100 | #144 | Excellent 64.6% |
| Welsh | 80.1 /100 | #145 | Excellent 64.6% |