Immigrants from North Macedonia vs Aleut Child Poverty Among Boys Under 16
COMPARE
Immigrants from North Macedonia
Aleut
Child Poverty Among Boys Under 16
Child Poverty Among Boys Under 16 Comparison
Immigrants from North Macedonia
Aleuts
14.9%
CHILD POVERTY AMONG BOYS UNDER 16
96.3/ 100
METRIC RATING
96th/ 347
METRIC RANK
17.7%
CHILD POVERTY AMONG BOYS UNDER 16
6.6/ 100
METRIC RATING
212th/ 347
METRIC RANK
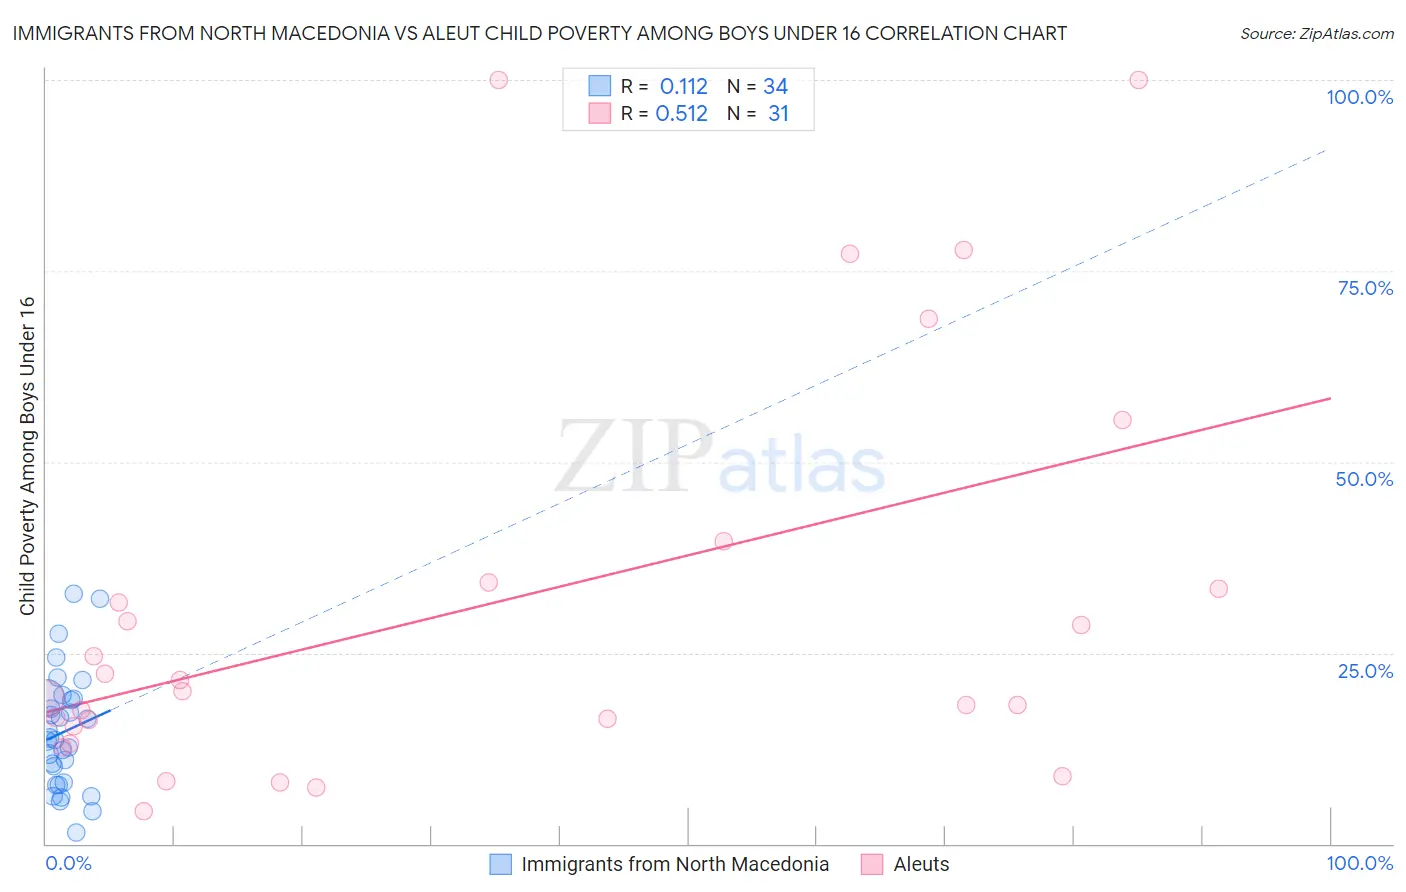
Immigrants from North Macedonia vs Aleut Child Poverty Among Boys Under 16 Correlation Chart
The statistical analysis conducted on geographies consisting of 73,631,017 people shows a poor positive correlation between the proportion of Immigrants from North Macedonia and poverty level among boys under the age of 16 in the United States with a correlation coefficient (R) of 0.112 and weighted average of 14.9%. Similarly, the statistical analysis conducted on geographies consisting of 61,373,672 people shows a substantial positive correlation between the proportion of Aleuts and poverty level among boys under the age of 16 in the United States with a correlation coefficient (R) of 0.512 and weighted average of 17.7%, a difference of 18.1%.
Child Poverty Among Boys Under 16 Correlation Summary
| Measurement | Immigrants from North Macedonia | Aleut |
| Minimum | 1.4% | 4.2% |
| Maximum | 32.7% | 100.0% |
| Range | 31.2% | 95.8% |
| Mean | 14.7% | 31.1% |
| Median | 13.7% | 20.0% |
| Interquartile 25% (IQ1) | 8.1% | 15.3% |
| Interquartile 75% (IQ3) | 19.1% | 34.3% |
| Interquartile Range (IQR) | 11.0% | 19.0% |
| Standard Deviation (Sample) | 7.6% | 26.7% |
| Standard Deviation (Population) | 7.4% | 26.2% |
Similar Demographics by Child Poverty Among Boys Under 16
Demographics Similar to Immigrants from North Macedonia by Child Poverty Among Boys Under 16
In terms of child poverty among boys under 16, the demographic groups most similar to Immigrants from North Macedonia are Immigrants from Egypt (14.9%, a difference of 0.010%), British (15.0%, a difference of 0.050%), Immigrants from France (15.0%, a difference of 0.15%), Finnish (14.9%, a difference of 0.25%), and Sri Lankan (14.9%, a difference of 0.36%).
| Demographics | Rating | Rank | Child Poverty Among Boys Under 16 |
| Immigrants | Argentina | 97.1 /100 | #89 | Exceptional 14.8% |
| Austrians | 97.1 /100 | #90 | Exceptional 14.8% |
| Paraguayans | 96.8 /100 | #91 | Exceptional 14.9% |
| Argentineans | 96.7 /100 | #92 | Exceptional 14.9% |
| Sri Lankans | 96.7 /100 | #93 | Exceptional 14.9% |
| Immigrants | Italy | 96.7 /100 | #94 | Exceptional 14.9% |
| Finns | 96.5 /100 | #95 | Exceptional 14.9% |
| Immigrants | North Macedonia | 96.3 /100 | #96 | Exceptional 14.9% |
| Immigrants | Egypt | 96.2 /100 | #97 | Exceptional 14.9% |
| British | 96.2 /100 | #98 | Exceptional 15.0% |
| Immigrants | France | 96.1 /100 | #99 | Exceptional 15.0% |
| Chileans | 95.8 /100 | #100 | Exceptional 15.0% |
| Immigrants | Belarus | 95.7 /100 | #101 | Exceptional 15.0% |
| Romanians | 95.6 /100 | #102 | Exceptional 15.0% |
| Immigrants | Denmark | 95.6 /100 | #103 | Exceptional 15.0% |
Demographics Similar to Aleuts by Child Poverty Among Boys Under 16
In terms of child poverty among boys under 16, the demographic groups most similar to Aleuts are Immigrants (17.6%, a difference of 0.050%), Immigrants from Armenia (17.6%, a difference of 0.11%), Immigrants from Eastern Africa (17.7%, a difference of 0.28%), Panamanian (17.7%, a difference of 0.28%), and Alaskan Athabascan (17.6%, a difference of 0.29%).
| Demographics | Rating | Rank | Child Poverty Among Boys Under 16 |
| Immigrants | Portugal | 11.2 /100 | #205 | Poor 17.4% |
| German Russians | 10.9 /100 | #206 | Poor 17.4% |
| Immigrants | Thailand | 8.2 /100 | #207 | Tragic 17.5% |
| Malaysians | 7.6 /100 | #208 | Tragic 17.6% |
| Alaskan Athabascans | 7.3 /100 | #209 | Tragic 17.6% |
| Immigrants | Armenia | 6.8 /100 | #210 | Tragic 17.6% |
| Immigrants | Immigrants | 6.7 /100 | #211 | Tragic 17.6% |
| Aleuts | 6.6 /100 | #212 | Tragic 17.7% |
| Immigrants | Eastern Africa | 6.0 /100 | #213 | Tragic 17.7% |
| Panamanians | 5.9 /100 | #214 | Tragic 17.7% |
| Osage | 5.8 /100 | #215 | Tragic 17.7% |
| Moroccans | 5.6 /100 | #216 | Tragic 17.7% |
| Japanese | 5.5 /100 | #217 | Tragic 17.7% |
| Iraqis | 5.5 /100 | #218 | Tragic 17.7% |
| Sierra Leoneans | 5.3 /100 | #219 | Tragic 17.8% |