Immigrants from North Macedonia vs Irish Family Households
COMPARE
Immigrants from North Macedonia
Irish
Family Households
Family Households Comparison
Immigrants from North Macedonia
Irish
64.7%
FAMILY HOUSEHOLDS
84.9/ 100
METRIC RATING
140th/ 347
METRIC RANK
64.4%
FAMILY HOUSEHOLDS
57.9/ 100
METRIC RATING
167th/ 347
METRIC RANK
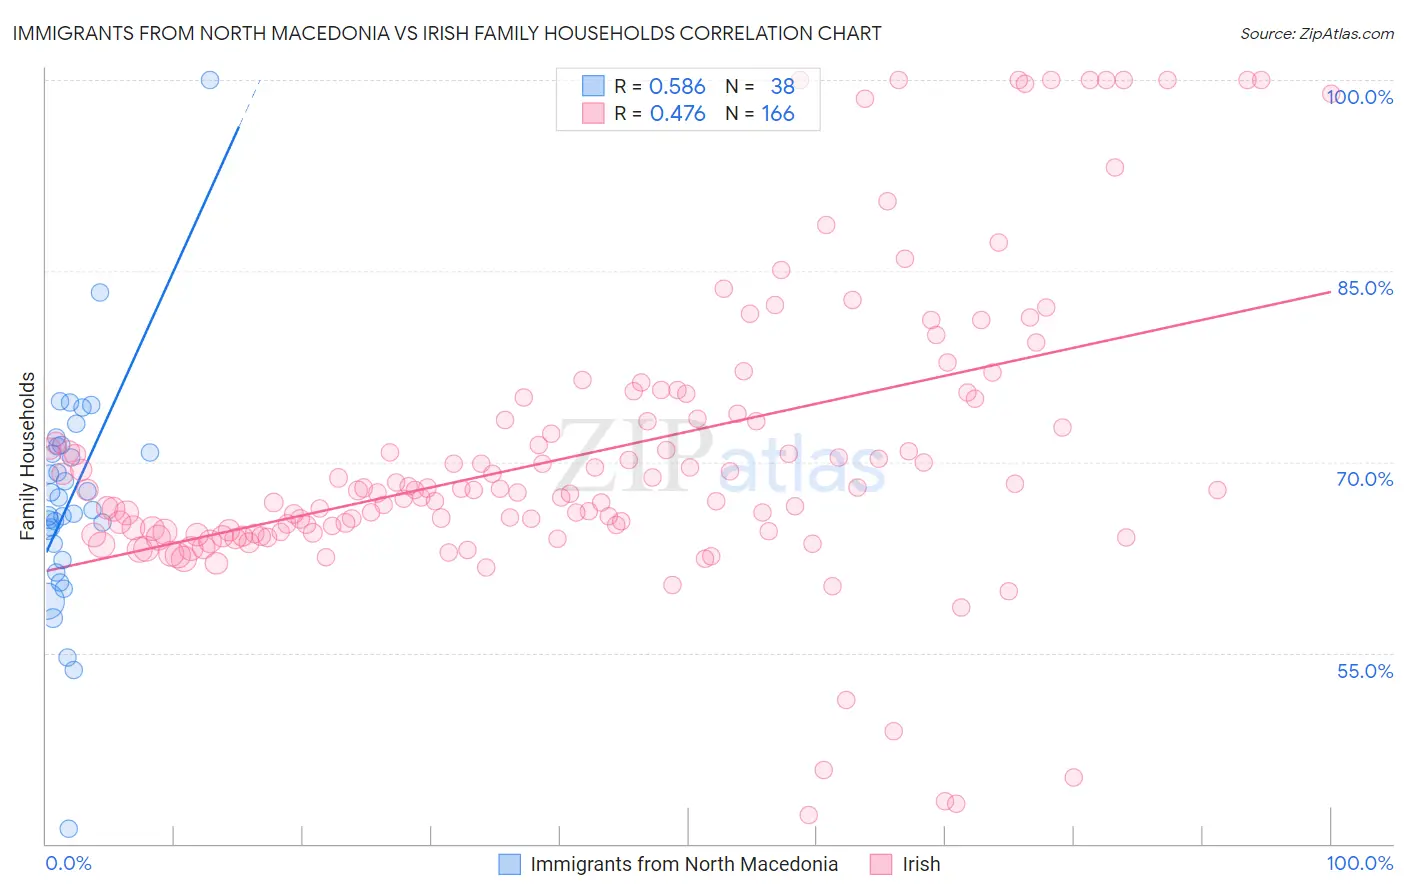
Immigrants from North Macedonia vs Irish Family Households Correlation Chart
The statistical analysis conducted on geographies consisting of 74,306,697 people shows a substantial positive correlation between the proportion of Immigrants from North Macedonia and percentage of family households in the United States with a correlation coefficient (R) of 0.586 and weighted average of 64.7%. Similarly, the statistical analysis conducted on geographies consisting of 580,015,491 people shows a moderate positive correlation between the proportion of Irish and percentage of family households in the United States with a correlation coefficient (R) of 0.476 and weighted average of 64.4%, a difference of 0.47%.
Family Households Correlation Summary
| Measurement | Immigrants from North Macedonia | Irish |
| Minimum | 41.2% | 42.2% |
| Maximum | 100.0% | 100.0% |
| Range | 58.8% | 57.8% |
| Mean | 67.2% | 70.7% |
| Median | 66.7% | 67.8% |
| Interquartile 25% (IQ1) | 63.5% | 64.5% |
| Interquartile 75% (IQ3) | 71.2% | 73.8% |
| Interquartile Range (IQR) | 7.7% | 9.3% |
| Standard Deviation (Sample) | 9.1% | 11.6% |
| Standard Deviation (Population) | 9.0% | 11.5% |
Similar Demographics by Family Households
Demographics Similar to Immigrants from North Macedonia by Family Households
In terms of family households, the demographic groups most similar to Immigrants from North Macedonia are Immigrants from Cameroon (64.7%, a difference of 0.0%), Immigrants from Jamaica (64.7%, a difference of 0.010%), Basque (64.7%, a difference of 0.020%), Pakistani (64.7%, a difference of 0.020%), and Immigrants from China (64.7%, a difference of 0.040%).
| Demographics | Rating | Rank | Family Households |
| Belizeans | 89.3 /100 | #133 | Excellent 64.8% |
| Greeks | 88.1 /100 | #134 | Excellent 64.7% |
| Maltese | 87.4 /100 | #135 | Excellent 64.7% |
| Immigrants | China | 86.6 /100 | #136 | Excellent 64.7% |
| Immigrants | Scotland | 86.4 /100 | #137 | Excellent 64.7% |
| Basques | 85.5 /100 | #138 | Excellent 64.7% |
| Immigrants | Jamaica | 85.3 /100 | #139 | Excellent 64.7% |
| Immigrants | North Macedonia | 84.9 /100 | #140 | Excellent 64.7% |
| Immigrants | Cameroon | 84.8 /100 | #141 | Excellent 64.7% |
| Pakistanis | 84.0 /100 | #142 | Excellent 64.7% |
| Czechoslovakians | 82.1 /100 | #143 | Excellent 64.6% |
| South American Indians | 81.9 /100 | #144 | Excellent 64.6% |
| Welsh | 80.1 /100 | #145 | Excellent 64.6% |
| Immigrants | Romania | 77.0 /100 | #146 | Good 64.6% |
| Immigrants | Chile | 76.5 /100 | #147 | Good 64.6% |
Demographics Similar to Irish by Family Households
In terms of family households, the demographic groups most similar to Irish are Honduran (64.4%, a difference of 0.010%), Scotch-Irish (64.4%, a difference of 0.020%), Immigrants from Nigeria (64.4%, a difference of 0.030%), Immigrants from Southern Europe (64.4%, a difference of 0.030%), and Iraqi (64.4%, a difference of 0.030%).
| Demographics | Rating | Rank | Family Households |
| Immigrants | Moldova | 65.2 /100 | #160 | Good 64.4% |
| Immigrants | England | 62.6 /100 | #161 | Good 64.4% |
| British | 61.6 /100 | #162 | Good 64.4% |
| Chickasaw | 61.5 /100 | #163 | Good 64.4% |
| Immigrants | Nigeria | 60.1 /100 | #164 | Good 64.4% |
| Immigrants | Southern Europe | 60.0 /100 | #165 | Good 64.4% |
| Scotch-Irish | 59.2 /100 | #166 | Average 64.4% |
| Irish | 57.9 /100 | #167 | Average 64.4% |
| Hondurans | 57.5 /100 | #168 | Average 64.4% |
| Iraqis | 56.0 /100 | #169 | Average 64.4% |
| Armenians | 55.9 /100 | #170 | Average 64.4% |
| Ute | 54.6 /100 | #171 | Average 64.3% |
| Dutch West Indians | 53.9 /100 | #172 | Average 64.3% |
| Immigrants | Sierra Leone | 52.5 /100 | #173 | Average 64.3% |
| Immigrants | Germany | 50.0 /100 | #174 | Average 64.3% |