Immigrants from Somalia vs Belgian Currently Married
COMPARE
Immigrants from Somalia
Belgian
Currently Married
Currently Married Comparison
Immigrants from Somalia
Belgians
41.2%
CURRENTLY MARRIED
0.0/ 100
METRIC RATING
319th/ 347
METRIC RANK
48.7%
CURRENTLY MARRIED
99.3/ 100
METRIC RATING
45th/ 347
METRIC RANK
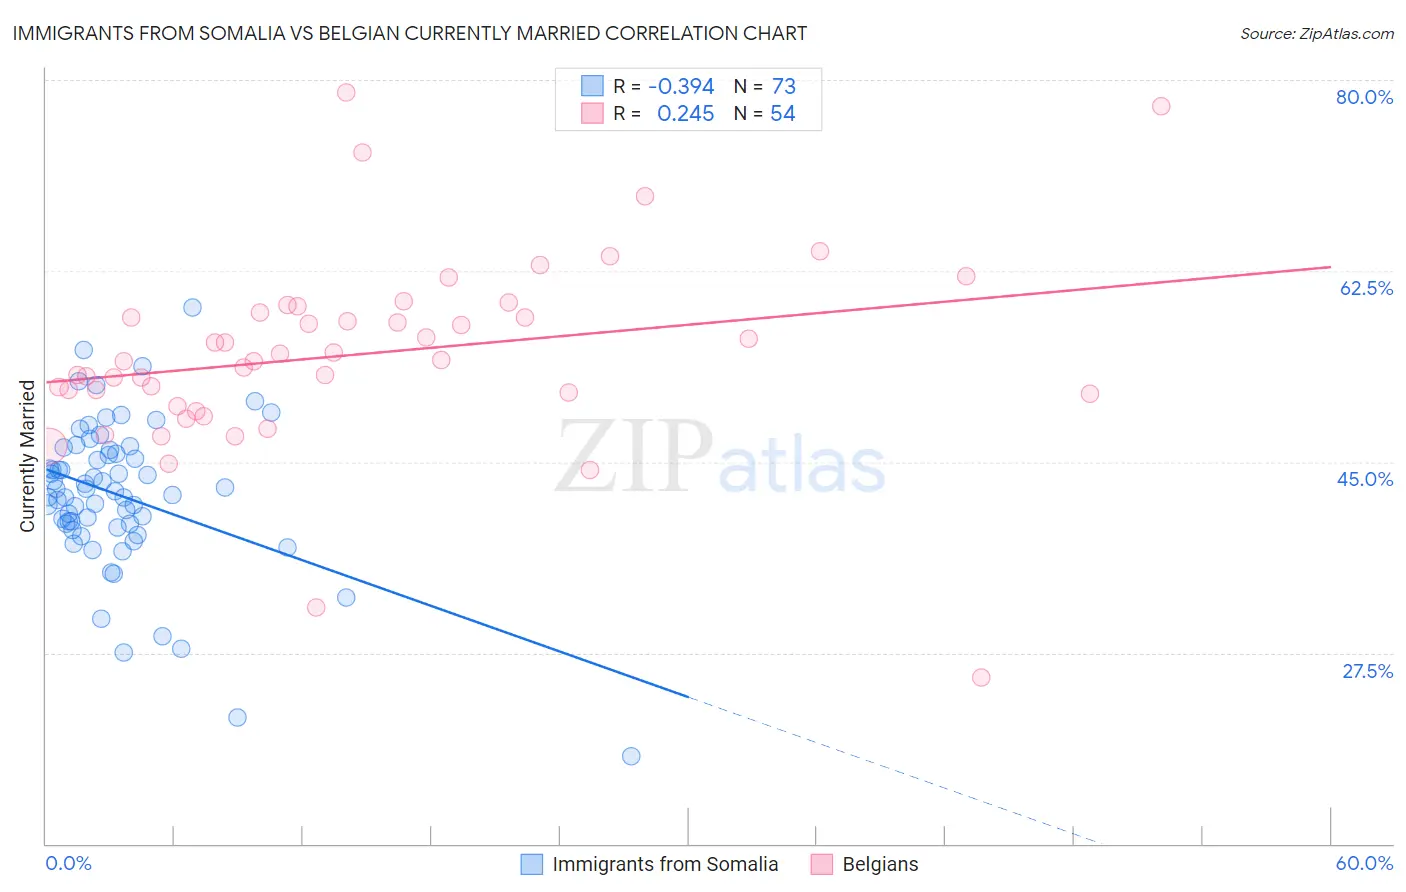
Immigrants from Somalia vs Belgian Currently Married Correlation Chart
The statistical analysis conducted on geographies consisting of 92,108,089 people shows a mild negative correlation between the proportion of Immigrants from Somalia and percentage of population currently married in the United States with a correlation coefficient (R) of -0.394 and weighted average of 41.2%. Similarly, the statistical analysis conducted on geographies consisting of 355,993,488 people shows a weak positive correlation between the proportion of Belgians and percentage of population currently married in the United States with a correlation coefficient (R) of 0.245 and weighted average of 48.7%, a difference of 18.3%.
Currently Married Correlation Summary
| Measurement | Immigrants from Somalia | Belgian |
| Minimum | 18.0% | 25.2% |
| Maximum | 59.1% | 78.9% |
| Range | 41.1% | 53.7% |
| Mean | 41.9% | 54.9% |
| Median | 42.3% | 54.3% |
| Interquartile 25% (IQ1) | 39.1% | 51.3% |
| Interquartile 75% (IQ3) | 45.9% | 58.7% |
| Interquartile Range (IQR) | 6.8% | 7.4% |
| Standard Deviation (Sample) | 7.0% | 9.0% |
| Standard Deviation (Population) | 6.9% | 8.9% |
Similar Demographics by Currently Married
Demographics Similar to Immigrants from Somalia by Currently Married
In terms of currently married, the demographic groups most similar to Immigrants from Somalia are Bahamian (41.2%, a difference of 0.020%), Immigrants from Jamaica (41.1%, a difference of 0.060%), Haitian (41.3%, a difference of 0.20%), Immigrants from Caribbean (41.3%, a difference of 0.22%), and Inupiat (41.3%, a difference of 0.28%).
| Demographics | Rating | Rank | Currently Married |
| Somalis | 0.0 /100 | #312 | Tragic 41.5% |
| Jamaicans | 0.0 /100 | #313 | Tragic 41.4% |
| West Indians | 0.0 /100 | #314 | Tragic 41.3% |
| Inupiat | 0.0 /100 | #315 | Tragic 41.3% |
| Immigrants | Caribbean | 0.0 /100 | #316 | Tragic 41.3% |
| Haitians | 0.0 /100 | #317 | Tragic 41.3% |
| Bahamians | 0.0 /100 | #318 | Tragic 41.2% |
| Immigrants | Somalia | 0.0 /100 | #319 | Tragic 41.2% |
| Immigrants | Jamaica | 0.0 /100 | #320 | Tragic 41.1% |
| Immigrants | Congo | 0.0 /100 | #321 | Tragic 41.1% |
| Immigrants | Haiti | 0.0 /100 | #322 | Tragic 41.0% |
| Immigrants | West Indies | 0.0 /100 | #323 | Tragic 40.7% |
| Immigrants | Senegal | 0.0 /100 | #324 | Tragic 40.7% |
| U.S. Virgin Islanders | 0.0 /100 | #325 | Tragic 40.7% |
| Barbadians | 0.0 /100 | #326 | Tragic 40.6% |
Demographics Similar to Belgians by Currently Married
In terms of currently married, the demographic groups most similar to Belgians are Immigrants from North America (48.7%, a difference of 0.030%), Immigrants from Iran (48.7%, a difference of 0.030%), Northern European (48.7%, a difference of 0.040%), Austrian (48.7%, a difference of 0.050%), and Finnish (48.8%, a difference of 0.060%).
| Demographics | Rating | Rank | Currently Married |
| Czechoslovakians | 99.4 /100 | #38 | Exceptional 48.8% |
| British | 99.4 /100 | #39 | Exceptional 48.8% |
| Immigrants | Canada | 99.4 /100 | #40 | Exceptional 48.8% |
| Greeks | 99.3 /100 | #41 | Exceptional 48.8% |
| Finns | 99.3 /100 | #42 | Exceptional 48.8% |
| Scotch-Irish | 99.3 /100 | #43 | Exceptional 48.7% |
| Immigrants | North America | 99.3 /100 | #44 | Exceptional 48.7% |
| Belgians | 99.3 /100 | #45 | Exceptional 48.7% |
| Immigrants | Iran | 99.2 /100 | #46 | Exceptional 48.7% |
| Northern Europeans | 99.2 /100 | #47 | Exceptional 48.7% |
| Austrians | 99.2 /100 | #48 | Exceptional 48.7% |
| Bhutanese | 99.1 /100 | #49 | Exceptional 48.6% |
| Iranians | 99.0 /100 | #50 | Exceptional 48.6% |
| Whites/Caucasians | 99.0 /100 | #51 | Exceptional 48.6% |
| Russians | 98.9 /100 | #52 | Exceptional 48.6% |