Venezuelan vs Argentinean Married-couple Households
COMPARE
Venezuelan
Argentinean
Married-couple Households
Married-couple Households Comparison
Venezuelans
Argentineans
47.6%
MARRIED-COUPLE HOUSEHOLDS
93.8/ 100
METRIC RATING
113th/ 347
METRIC RANK
47.5%
MARRIED-COUPLE HOUSEHOLDS
92.5/ 100
METRIC RATING
116th/ 347
METRIC RANK
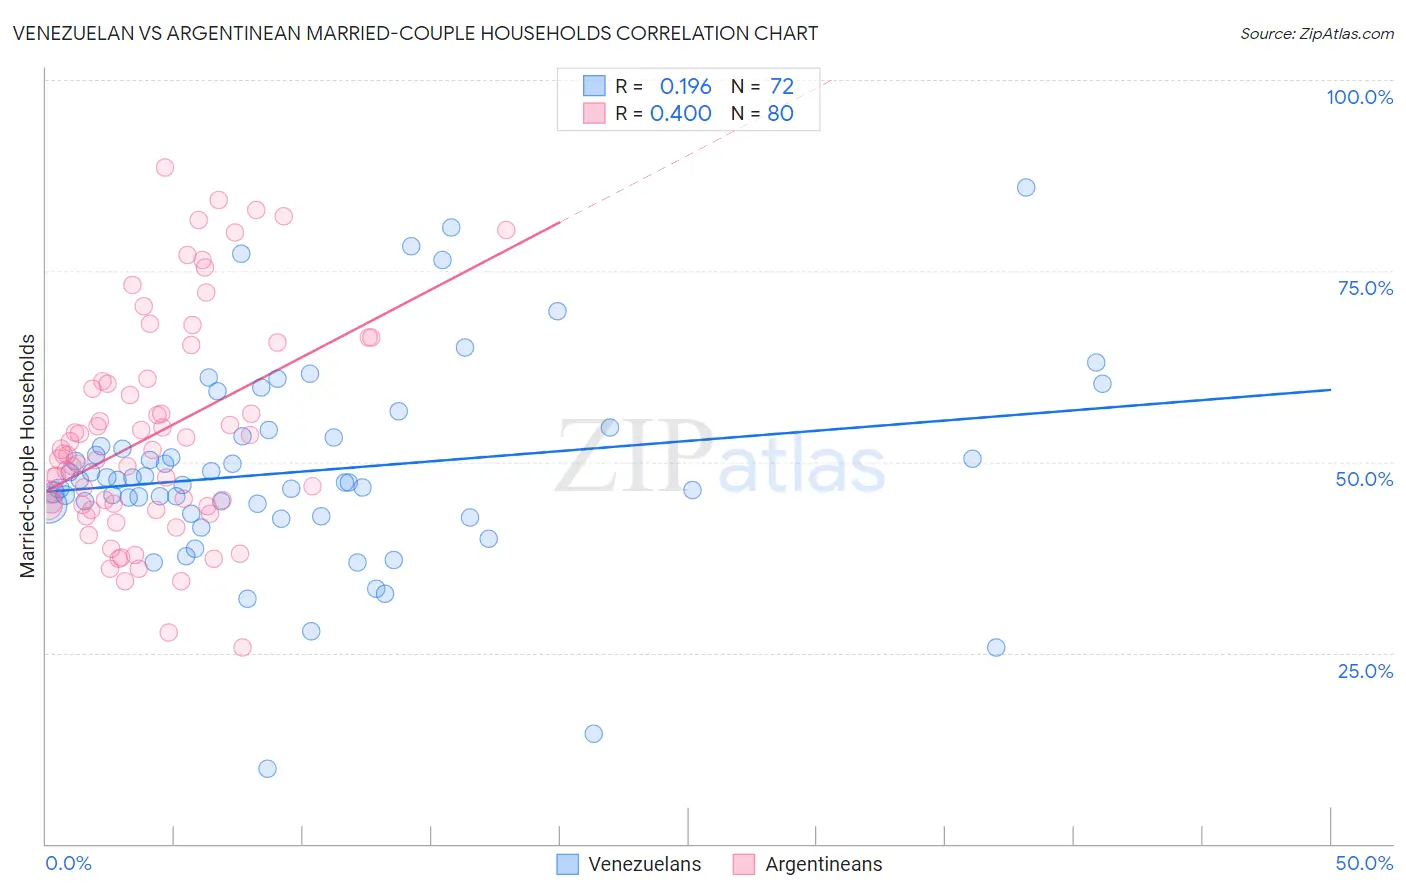
Venezuelan vs Argentinean Married-couple Households Correlation Chart
The statistical analysis conducted on geographies consisting of 306,133,854 people shows a poor positive correlation between the proportion of Venezuelans and percentage of married-couple family households in the United States with a correlation coefficient (R) of 0.196 and weighted average of 47.6%. Similarly, the statistical analysis conducted on geographies consisting of 296,995,795 people shows a mild positive correlation between the proportion of Argentineans and percentage of married-couple family households in the United States with a correlation coefficient (R) of 0.400 and weighted average of 47.5%, a difference of 0.18%.
Married-couple Households Correlation Summary
| Measurement | Venezuelan | Argentinean |
| Minimum | 9.8% | 25.6% |
| Maximum | 86.0% | 88.5% |
| Range | 76.1% | 62.9% |
| Mean | 48.8% | 53.7% |
| Median | 47.4% | 51.0% |
| Interquartile 25% (IQ1) | 43.7% | 44.3% |
| Interquartile 75% (IQ3) | 53.2% | 60.7% |
| Interquartile Range (IQR) | 9.5% | 16.4% |
| Standard Deviation (Sample) | 13.2% | 14.3% |
| Standard Deviation (Population) | 13.1% | 14.2% |
Demographics Similar to Venezuelans and Argentineans by Married-couple Households
In terms of married-couple households, the demographic groups most similar to Venezuelans are Peruvian (47.6%, a difference of 0.010%), Immigrants from Europe (47.6%, a difference of 0.010%), Syrian (47.6%, a difference of 0.020%), Macedonian (47.6%, a difference of 0.030%), and Immigrants from Jordan (47.7%, a difference of 0.050%). Similarly, the demographic groups most similar to Argentineans are French Canadian (47.5%, a difference of 0.010%), Immigrants from Germany (47.5%, a difference of 0.020%), Slovak (47.6%, a difference of 0.050%), Chilean (47.5%, a difference of 0.050%), and Immigrants from Europe (47.6%, a difference of 0.17%).
| Demographics | Rating | Rank | Married-couple Households |
| Immigrants | South Africa | 96.0 /100 | #104 | Exceptional 47.8% |
| Immigrants | Czechoslovakia | 95.5 /100 | #105 | Exceptional 47.8% |
| Portuguese | 95.5 /100 | #106 | Exceptional 47.8% |
| Estonians | 94.7 /100 | #107 | Exceptional 47.7% |
| Immigrants | Japan | 94.4 /100 | #108 | Exceptional 47.7% |
| Immigrants | Jordan | 94.1 /100 | #109 | Exceptional 47.7% |
| Macedonians | 93.9 /100 | #110 | Exceptional 47.6% |
| Syrians | 93.9 /100 | #111 | Exceptional 47.6% |
| Peruvians | 93.8 /100 | #112 | Exceptional 47.6% |
| Venezuelans | 93.8 /100 | #113 | Exceptional 47.6% |
| Immigrants | Europe | 93.7 /100 | #114 | Exceptional 47.6% |
| Slovaks | 92.9 /100 | #115 | Exceptional 47.6% |
| Argentineans | 92.5 /100 | #116 | Exceptional 47.5% |
| French Canadians | 92.4 /100 | #117 | Exceptional 47.5% |
| Immigrants | Germany | 92.4 /100 | #118 | Exceptional 47.5% |
| Chileans | 92.2 /100 | #119 | Exceptional 47.5% |
| Puget Sound Salish | 90.5 /100 | #120 | Exceptional 47.4% |
| Immigrants | Eastern Europe | 90.3 /100 | #121 | Exceptional 47.4% |
| Okinawans | 90.1 /100 | #122 | Exceptional 47.4% |
| Immigrants | Venezuela | 89.3 /100 | #123 | Excellent 47.4% |
| Zimbabweans | 89.2 /100 | #124 | Excellent 47.4% |