Immigrants from Mexico vs Norwegian Divorced or Separated
COMPARE
Immigrants from Mexico
Norwegian
Divorced or Separated
Divorced or Separated Comparison
Immigrants from Mexico
Norwegians
12.0%
DIVORCED OR SEPARATED
53.2/ 100
METRIC RATING
172nd/ 347
METRIC RANK
12.1%
DIVORCED OR SEPARATED
33.2/ 100
METRIC RATING
192nd/ 347
METRIC RANK
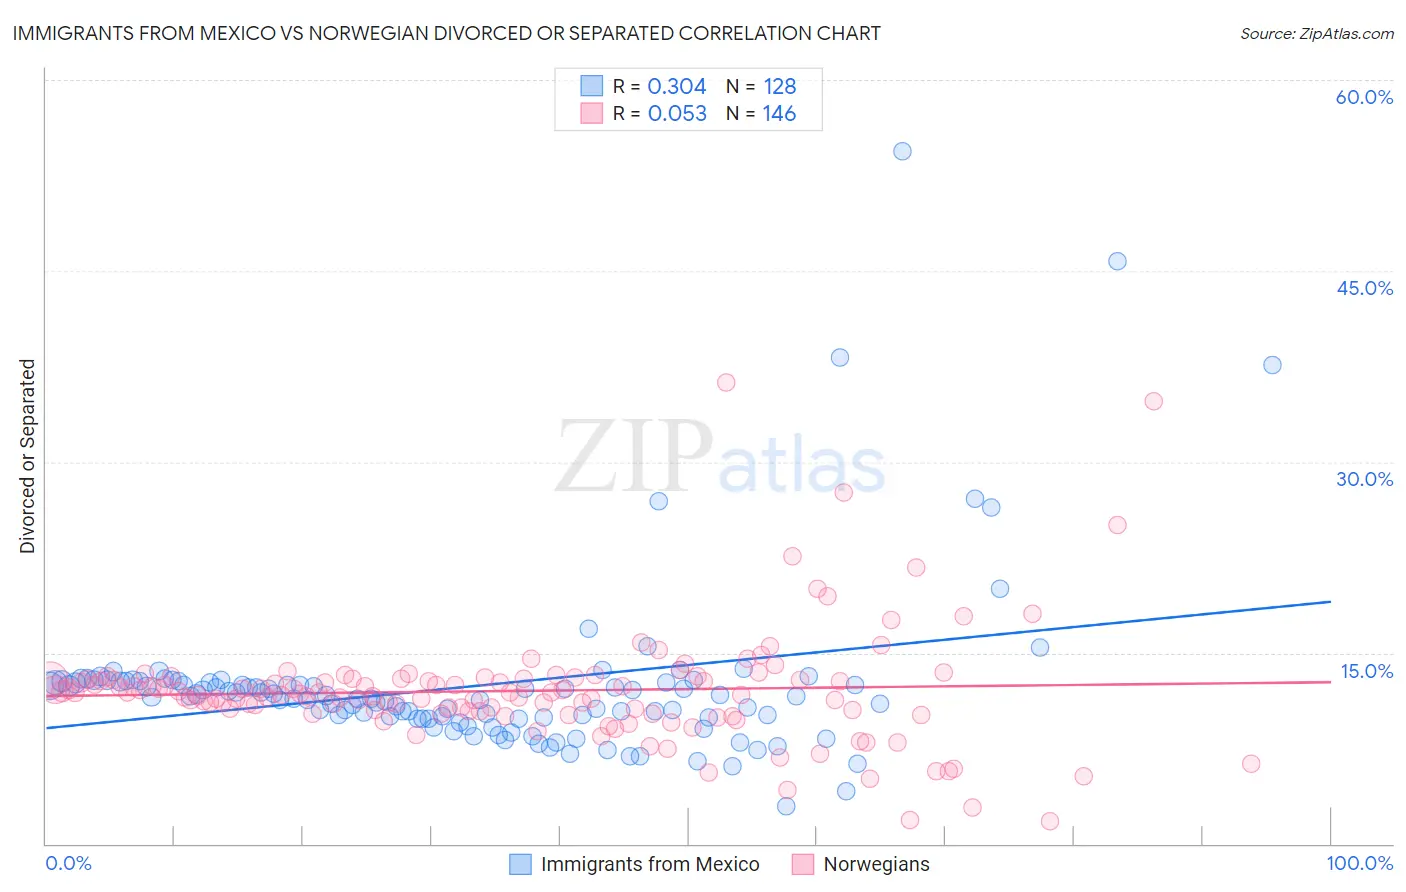
Immigrants from Mexico vs Norwegian Divorced or Separated Correlation Chart
The statistical analysis conducted on geographies consisting of 513,547,698 people shows a mild positive correlation between the proportion of Immigrants from Mexico and percentage of population currently divorced or separated in the United States with a correlation coefficient (R) of 0.304 and weighted average of 12.0%. Similarly, the statistical analysis conducted on geographies consisting of 533,039,037 people shows a slight positive correlation between the proportion of Norwegians and percentage of population currently divorced or separated in the United States with a correlation coefficient (R) of 0.053 and weighted average of 12.1%, a difference of 0.72%.
Divorced or Separated Correlation Summary
| Measurement | Immigrants from Mexico | Norwegian |
| Minimum | 3.0% | 1.8% |
| Maximum | 54.4% | 36.2% |
| Range | 51.4% | 34.4% |
| Mean | 12.4% | 12.0% |
| Median | 11.5% | 11.8% |
| Interquartile 25% (IQ1) | 9.9% | 10.4% |
| Interquartile 75% (IQ3) | 12.7% | 12.9% |
| Interquartile Range (IQR) | 2.8% | 2.5% |
| Standard Deviation (Sample) | 6.7% | 4.5% |
| Standard Deviation (Population) | 6.7% | 4.5% |
Demographics Similar to Immigrants from Mexico and Norwegians by Divorced or Separated
In terms of divorced or separated, the demographic groups most similar to Immigrants from Mexico are Immigrants from Moldova (12.1%, a difference of 0.090%), Hawaiian (12.1%, a difference of 0.11%), Immigrants from Sierra Leone (12.1%, a difference of 0.11%), Pennsylvania German (12.1%, a difference of 0.15%), and Brazilian (12.1%, a difference of 0.19%). Similarly, the demographic groups most similar to Norwegians are Swedish (12.1%, a difference of 0.050%), Moroccan (12.1%, a difference of 0.060%), Sierra Leonean (12.1%, a difference of 0.090%), Belizean (12.1%, a difference of 0.17%), and Immigrants from Belize (12.1%, a difference of 0.17%).
| Demographics | Rating | Rank | Divorced or Separated |
| Immigrants | Mexico | 53.2 /100 | #172 | Average 12.0% |
| Immigrants | Moldova | 50.4 /100 | #173 | Average 12.1% |
| Hawaiians | 50.0 /100 | #174 | Average 12.1% |
| Immigrants | Sierra Leone | 50.0 /100 | #175 | Average 12.1% |
| Pennsylvania Germans | 48.9 /100 | #176 | Average 12.1% |
| Brazilians | 47.7 /100 | #177 | Average 12.1% |
| Ghanaians | 45.9 /100 | #178 | Average 12.1% |
| Immigrants | Western Europe | 45.6 /100 | #179 | Average 12.1% |
| Barbadians | 45.0 /100 | #180 | Average 12.1% |
| Immigrants | Canada | 44.0 /100 | #181 | Average 12.1% |
| Immigrants | Ethiopia | 43.1 /100 | #182 | Average 12.1% |
| Immigrants | Central America | 42.9 /100 | #183 | Average 12.1% |
| Immigrants | North America | 41.1 /100 | #184 | Average 12.1% |
| Immigrants | Nigeria | 40.5 /100 | #185 | Average 12.1% |
| Immigrants | Chile | 39.0 /100 | #186 | Fair 12.1% |
| Belizeans | 37.7 /100 | #187 | Fair 12.1% |
| Immigrants | Belize | 37.6 /100 | #188 | Fair 12.1% |
| Sierra Leoneans | 35.5 /100 | #189 | Fair 12.1% |
| Moroccans | 34.8 /100 | #190 | Fair 12.1% |
| Swedes | 34.4 /100 | #191 | Fair 12.1% |
| Norwegians | 33.2 /100 | #192 | Fair 12.1% |