Immigrants from Lithuania vs Immigrants from Denmark Married-couple Households
COMPARE
Immigrants from Lithuania
Immigrants from Denmark
Married-couple Households
Married-couple Households Comparison
Immigrants from Lithuania
Immigrants from Denmark
48.6%
MARRIED-COUPLE HOUSEHOLDS
99.3/ 100
METRIC RATING
54th/ 347
METRIC RANK
47.3%
MARRIED-COUPLE HOUSEHOLDS
87.5/ 100
METRIC RATING
131st/ 347
METRIC RANK
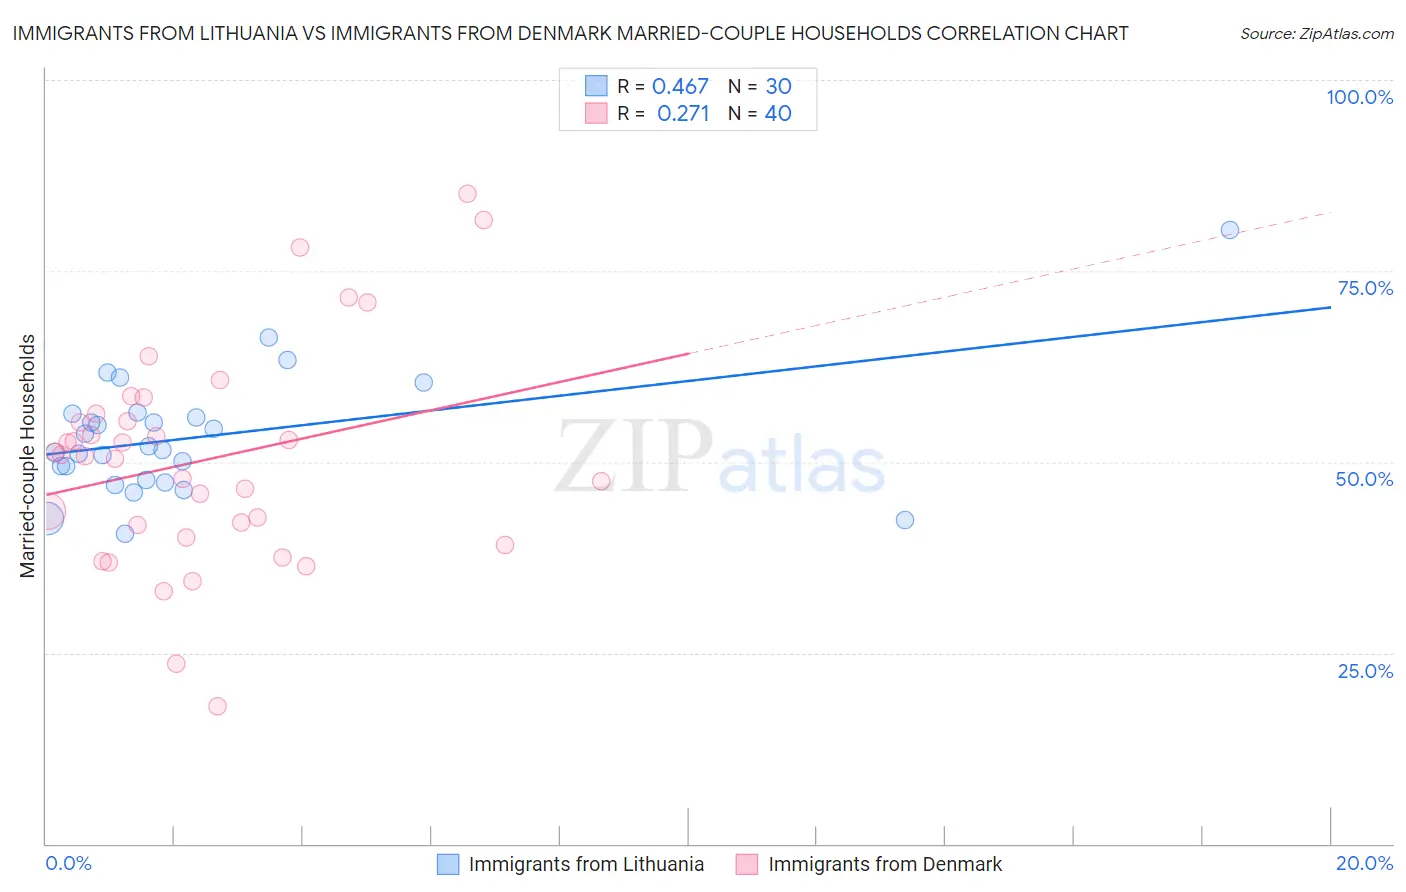
Immigrants from Lithuania vs Immigrants from Denmark Married-couple Households Correlation Chart
The statistical analysis conducted on geographies consisting of 117,713,976 people shows a moderate positive correlation between the proportion of Immigrants from Lithuania and percentage of married-couple family households in the United States with a correlation coefficient (R) of 0.467 and weighted average of 48.6%. Similarly, the statistical analysis conducted on geographies consisting of 136,404,996 people shows a weak positive correlation between the proportion of Immigrants from Denmark and percentage of married-couple family households in the United States with a correlation coefficient (R) of 0.271 and weighted average of 47.3%, a difference of 2.7%.
Married-couple Households Correlation Summary
| Measurement | Immigrants from Lithuania | Immigrants from Denmark |
| Minimum | 40.7% | 18.0% |
| Maximum | 80.4% | 85.1% |
| Range | 39.7% | 67.1% |
| Mean | 53.3% | 50.2% |
| Median | 51.7% | 50.8% |
| Interquartile 25% (IQ1) | 47.6% | 40.9% |
| Interquartile 75% (IQ3) | 56.4% | 55.8% |
| Interquartile Range (IQR) | 8.7% | 14.9% |
| Standard Deviation (Sample) | 8.1% | 14.3% |
| Standard Deviation (Population) | 7.9% | 14.1% |
Similar Demographics by Married-couple Households
Demographics Similar to Immigrants from Lithuania by Married-couple Households
In terms of married-couple households, the demographic groups most similar to Immigrants from Lithuania are White/Caucasian (48.6%, a difference of 0.010%), Austrian (48.6%, a difference of 0.010%), Immigrants from Northern Europe (48.6%, a difference of 0.010%), Irish (48.6%, a difference of 0.060%), and Eastern European (48.6%, a difference of 0.090%).
| Demographics | Rating | Rank | Married-couple Households |
| British | 99.5 /100 | #47 | Exceptional 48.7% |
| Indians (Asian) | 99.4 /100 | #48 | Exceptional 48.7% |
| Immigrants | Sri Lanka | 99.4 /100 | #49 | Exceptional 48.7% |
| Samoans | 99.4 /100 | #50 | Exceptional 48.7% |
| Eastern Europeans | 99.3 /100 | #51 | Exceptional 48.6% |
| Irish | 99.3 /100 | #52 | Exceptional 48.6% |
| Whites/Caucasians | 99.3 /100 | #53 | Exceptional 48.6% |
| Immigrants | Lithuania | 99.3 /100 | #54 | Exceptional 48.6% |
| Austrians | 99.3 /100 | #55 | Exceptional 48.6% |
| Immigrants | Northern Europe | 99.3 /100 | #56 | Exceptional 48.6% |
| Poles | 99.2 /100 | #57 | Exceptional 48.5% |
| Immigrants | Indonesia | 99.2 /100 | #58 | Exceptional 48.5% |
| Czechoslovakians | 99.2 /100 | #59 | Exceptional 48.5% |
| Croatians | 99.1 /100 | #60 | Exceptional 48.5% |
| Bulgarians | 99.1 /100 | #61 | Exceptional 48.5% |
Demographics Similar to Immigrants from Denmark by Married-couple Households
In terms of married-couple households, the demographic groups most similar to Immigrants from Denmark are Immigrants from Iraq (47.3%, a difference of 0.020%), Immigrants from Hungary (47.3%, a difference of 0.020%), Immigrants from Peru (47.3%, a difference of 0.030%), Celtic (47.3%, a difference of 0.050%), and Immigrants from Ukraine (47.3%, a difference of 0.070%).
| Demographics | Rating | Rank | Married-couple Households |
| Zimbabweans | 89.2 /100 | #124 | Excellent 47.4% |
| Australians | 89.0 /100 | #125 | Excellent 47.4% |
| Pakistanis | 88.6 /100 | #126 | Excellent 47.3% |
| Celtics | 88.1 /100 | #127 | Excellent 47.3% |
| Immigrants | Peru | 87.9 /100 | #128 | Excellent 47.3% |
| Immigrants | Iraq | 87.8 /100 | #129 | Excellent 47.3% |
| Immigrants | Hungary | 87.8 /100 | #130 | Excellent 47.3% |
| Immigrants | Denmark | 87.5 /100 | #131 | Excellent 47.3% |
| Immigrants | Ukraine | 86.7 /100 | #132 | Excellent 47.3% |
| South Africans | 86.4 /100 | #133 | Excellent 47.3% |
| Immigrants | Greece | 86.0 /100 | #134 | Excellent 47.2% |
| Immigrants | Argentina | 86.0 /100 | #135 | Excellent 47.2% |
| New Zealanders | 85.3 /100 | #136 | Excellent 47.2% |
| Immigrants | Malaysia | 85.2 /100 | #137 | Excellent 47.2% |
| Immigrants | Afghanistan | 85.1 /100 | #138 | Excellent 47.2% |