Immigrants from Lebanon vs Salvadoran No Schooling Completed
COMPARE
Immigrants from Lebanon
Salvadoran
No Schooling Completed
No Schooling Completed Comparison
Immigrants from Lebanon
Salvadorans
2.3%
NO SCHOOLING COMPLETED
4.5/ 100
METRIC RATING
223rd/ 347
METRIC RANK
3.7%
NO SCHOOLING COMPLETED
0.0/ 100
METRIC RATING
343rd/ 347
METRIC RANK
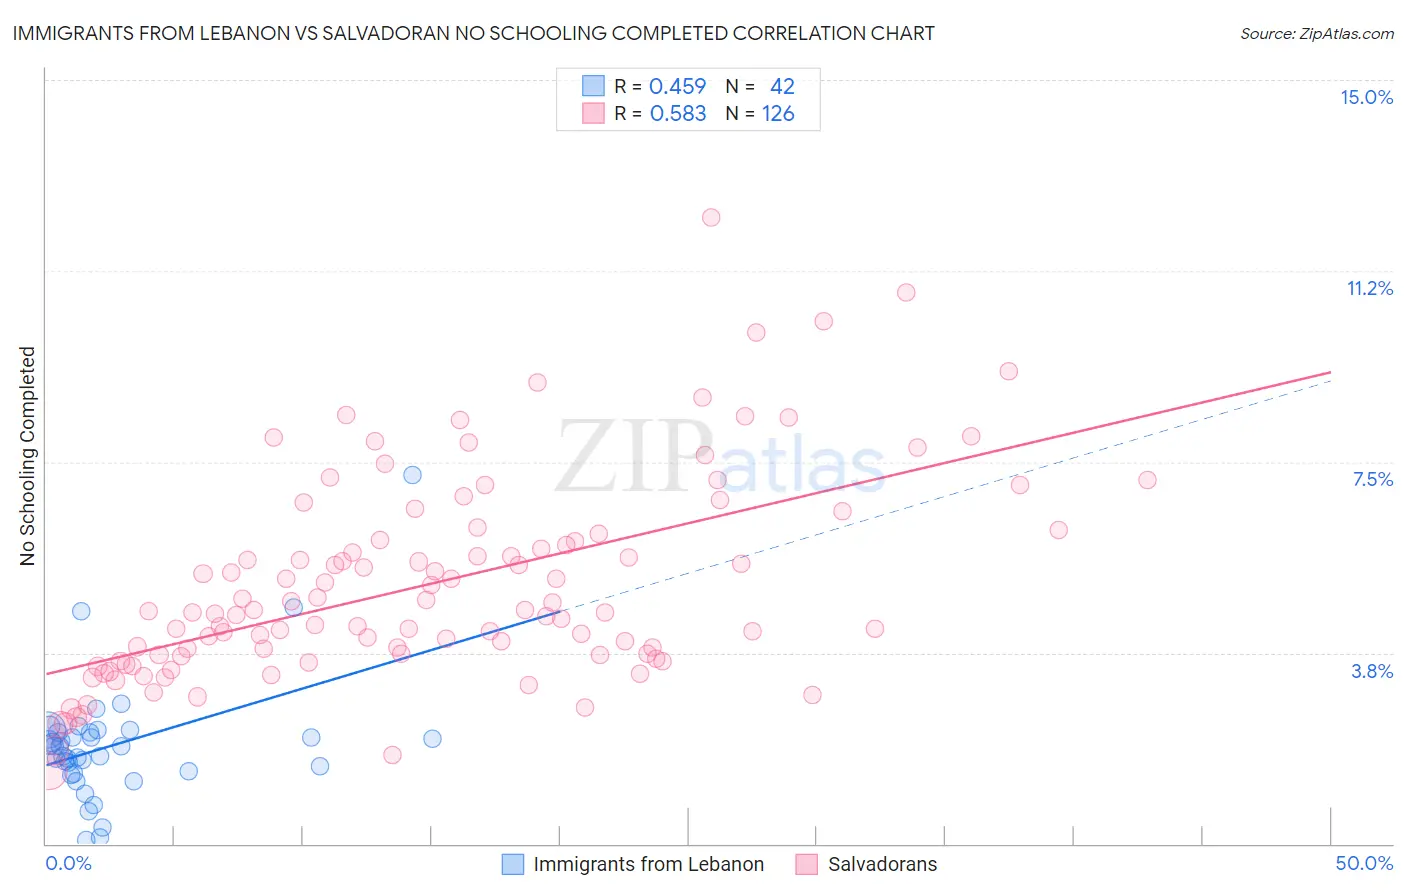
Immigrants from Lebanon vs Salvadoran No Schooling Completed Correlation Chart
The statistical analysis conducted on geographies consisting of 216,259,293 people shows a moderate positive correlation between the proportion of Immigrants from Lebanon and percentage of population with no schooling in the United States with a correlation coefficient (R) of 0.459 and weighted average of 2.3%. Similarly, the statistical analysis conducted on geographies consisting of 395,950,136 people shows a substantial positive correlation between the proportion of Salvadorans and percentage of population with no schooling in the United States with a correlation coefficient (R) of 0.583 and weighted average of 3.7%, a difference of 62.4%.
No Schooling Completed Correlation Summary
| Measurement | Immigrants from Lebanon | Salvadoran |
| Minimum | 0.079% | 1.4% |
| Maximum | 7.2% | 12.3% |
| Range | 7.2% | 10.9% |
| Mean | 2.0% | 5.1% |
| Median | 1.9% | 4.6% |
| Interquartile 25% (IQ1) | 1.4% | 3.7% |
| Interquartile 75% (IQ3) | 2.2% | 6.0% |
| Interquartile Range (IQR) | 0.77% | 2.3% |
| Standard Deviation (Sample) | 1.2% | 2.0% |
| Standard Deviation (Population) | 1.2% | 2.0% |
Similar Demographics by No Schooling Completed
Demographics Similar to Immigrants from Lebanon by No Schooling Completed
In terms of no schooling completed, the demographic groups most similar to Immigrants from Lebanon are Subsaharan African (2.3%, a difference of 0.15%), Tohono O'odham (2.3%, a difference of 0.29%), Sudanese (2.3%, a difference of 0.29%), Sierra Leonean (2.3%, a difference of 0.30%), and Immigrants from Sudan (2.3%, a difference of 0.33%).
| Demographics | Rating | Rank | No Schooling Completed |
| Tongans | 6.8 /100 | #216 | Tragic 2.3% |
| Immigrants | Syria | 6.6 /100 | #217 | Tragic 2.3% |
| Immigrants | Nepal | 6.4 /100 | #218 | Tragic 2.3% |
| Senegalese | 5.6 /100 | #219 | Tragic 2.3% |
| Immigrants | Costa Rica | 5.1 /100 | #220 | Tragic 2.3% |
| Immigrants | Sudan | 5.0 /100 | #221 | Tragic 2.3% |
| Sub-Saharan Africans | 4.7 /100 | #222 | Tragic 2.3% |
| Immigrants | Lebanon | 4.5 /100 | #223 | Tragic 2.3% |
| Tohono O'odham | 4.1 /100 | #224 | Tragic 2.3% |
| Sudanese | 4.1 /100 | #225 | Tragic 2.3% |
| Sierra Leoneans | 4.1 /100 | #226 | Tragic 2.3% |
| Immigrants | Uganda | 4.0 /100 | #227 | Tragic 2.3% |
| U.S. Virgin Islanders | 3.7 /100 | #228 | Tragic 2.3% |
| Immigrants | Pakistan | 3.6 /100 | #229 | Tragic 2.3% |
| Puerto Ricans | 3.4 /100 | #230 | Tragic 2.3% |
Demographics Similar to Salvadorans by No Schooling Completed
In terms of no schooling completed, the demographic groups most similar to Salvadorans are Nepalese (3.8%, a difference of 1.7%), Immigrants from Mexico (3.6%, a difference of 2.8%), Immigrants from El Salvador (3.9%, a difference of 3.5%), Immigrants from Central America (3.6%, a difference of 3.6%), and Immigrants from Guatemala (3.6%, a difference of 4.7%).
| Demographics | Rating | Rank | No Schooling Completed |
| Immigrants | Dominican Republic | 0.0 /100 | #333 | Tragic 3.4% |
| Guatemalans | 0.0 /100 | #334 | Tragic 3.5% |
| Immigrants | Cambodia | 0.0 /100 | #335 | Tragic 3.5% |
| Immigrants | Fiji | 0.0 /100 | #336 | Tragic 3.5% |
| Immigrants | Cabo Verde | 0.0 /100 | #337 | Tragic 3.5% |
| Bangladeshis | 0.0 /100 | #338 | Tragic 3.5% |
| Yakama | 0.0 /100 | #339 | Tragic 3.6% |
| Immigrants | Guatemala | 0.0 /100 | #340 | Tragic 3.6% |
| Immigrants | Central America | 0.0 /100 | #341 | Tragic 3.6% |
| Immigrants | Mexico | 0.0 /100 | #342 | Tragic 3.6% |
| Salvadorans | 0.0 /100 | #343 | Tragic 3.7% |
| Nepalese | 0.0 /100 | #344 | Tragic 3.8% |
| Immigrants | El Salvador | 0.0 /100 | #345 | Tragic 3.9% |
| Immigrants | Yemen | 0.0 /100 | #346 | Tragic 4.1% |
| Spanish American Indians | 0.0 /100 | #347 | Tragic 4.2% |