Immigrants from Lebanon vs Scottish Average Family Size
COMPARE
Immigrants from Lebanon
Scottish
Average Family Size
Average Family Size Comparison
Immigrants from Lebanon
Scottish
3.30
AVERAGE FAMILY SIZE
99.0/ 100
METRIC RATING
95th/ 347
METRIC RANK
3.11
AVERAGE FAMILY SIZE
0.0/ 100
METRIC RATING
332nd/ 347
METRIC RANK
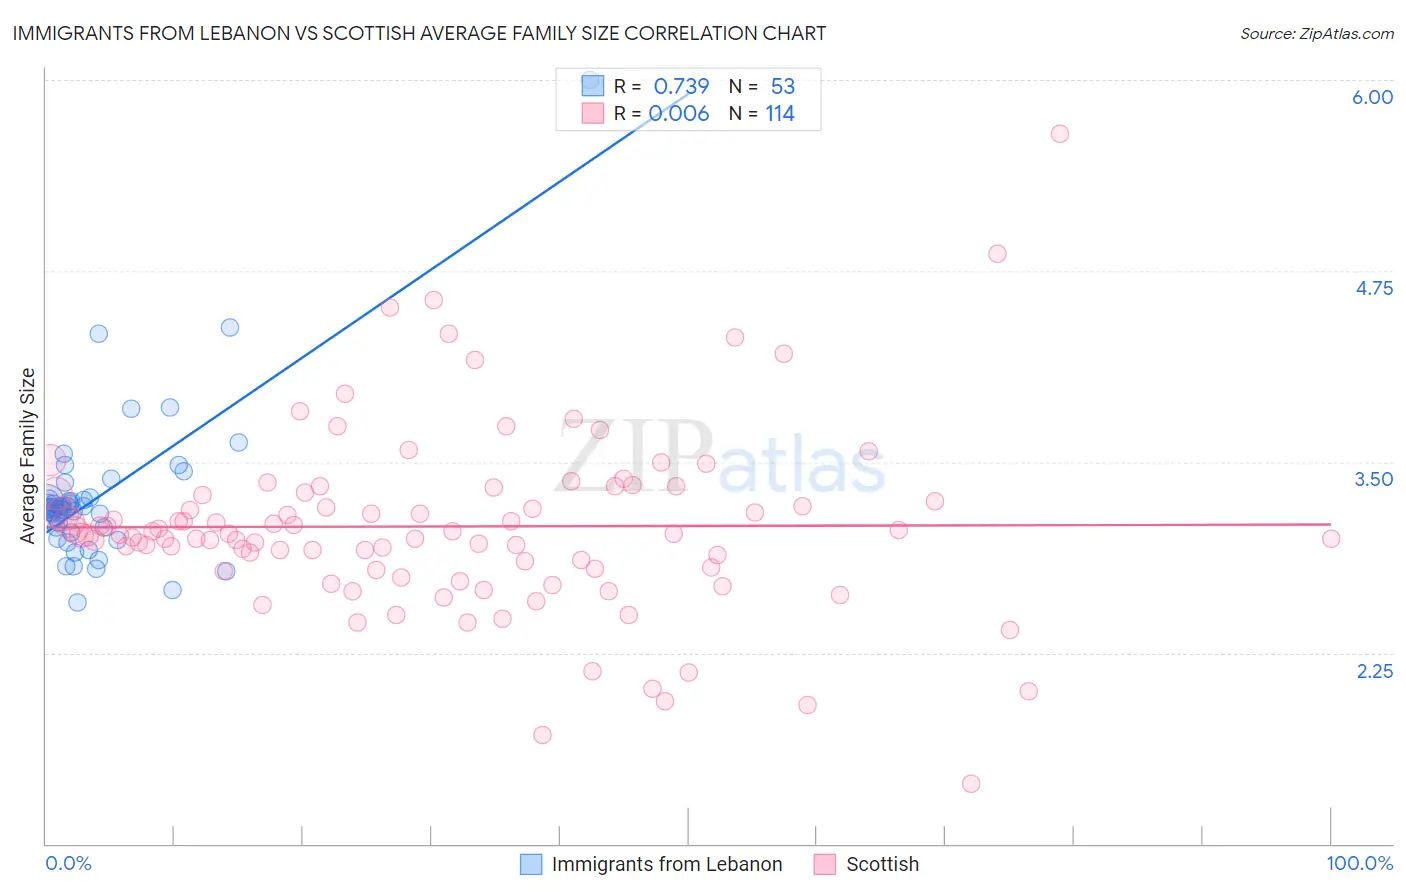
Immigrants from Lebanon vs Scottish Average Family Size Correlation Chart
The statistical analysis conducted on geographies consisting of 217,130,535 people shows a strong positive correlation between the proportion of Immigrants from Lebanon and average family size in the United States with a correlation coefficient (R) of 0.739 and weighted average of 3.30. Similarly, the statistical analysis conducted on geographies consisting of 566,567,315 people shows no correlation between the proportion of Scottish and average family size in the United States with a correlation coefficient (R) of 0.006 and weighted average of 3.11, a difference of 6.1%.
Average Family Size Correlation Summary
| Measurement | Immigrants from Lebanon | Scottish |
| Minimum | 2.58 | 1.39 |
| Maximum | 6.00 | 5.65 |
| Range | 3.42 | 4.26 |
| Mean | 3.27 | 3.08 |
| Median | 3.20 | 3.02 |
| Interquartile 25% (IQ1) | 3.05 | 2.80 |
| Interquartile 75% (IQ3) | 3.26 | 3.29 |
| Interquartile Range (IQR) | 0.21 | 0.49 |
| Standard Deviation (Sample) | 0.51 | 0.60 |
| Standard Deviation (Population) | 0.51 | 0.60 |
Similar Demographics by Average Family Size
Demographics Similar to Immigrants from Lebanon by Average Family Size
In terms of average family size, the demographic groups most similar to Immigrants from Lebanon are Sierra Leonean (3.30, a difference of 0.010%), U.S. Virgin Islander (3.29, a difference of 0.080%), Peruvian (3.30, a difference of 0.11%), Immigrants from Cameroon (3.30, a difference of 0.12%), and Immigrants from Oceania (3.29, a difference of 0.12%).
| Demographics | Rating | Rank | Average Family Size |
| Immigrants | Bolivia | 99.6 /100 | #88 | Exceptional 3.31 |
| Malaysians | 99.6 /100 | #89 | Exceptional 3.31 |
| Menominee | 99.4 /100 | #90 | Exceptional 3.30 |
| Immigrants | Pakistan | 99.2 /100 | #91 | Exceptional 3.30 |
| Immigrants | Cameroon | 99.2 /100 | #92 | Exceptional 3.30 |
| Peruvians | 99.2 /100 | #93 | Exceptional 3.30 |
| Sierra Leoneans | 99.0 /100 | #94 | Exceptional 3.30 |
| Immigrants | Lebanon | 99.0 /100 | #95 | Exceptional 3.30 |
| U.S. Virgin Islanders | 98.8 /100 | #96 | Exceptional 3.29 |
| Immigrants | Oceania | 98.7 /100 | #97 | Exceptional 3.29 |
| Barbadians | 98.6 /100 | #98 | Exceptional 3.29 |
| Nigerians | 98.6 /100 | #99 | Exceptional 3.29 |
| Guamanians/Chamorros | 98.6 /100 | #100 | Exceptional 3.29 |
| Immigrants | Burma/Myanmar | 98.6 /100 | #101 | Exceptional 3.29 |
| West Indians | 98.5 /100 | #102 | Exceptional 3.29 |
Demographics Similar to Scottish by Average Family Size
In terms of average family size, the demographic groups most similar to Scottish are Scotch-Irish (3.11, a difference of 0.0%), Latvian (3.11, a difference of 0.010%), Estonian (3.10, a difference of 0.050%), Lithuanian (3.10, a difference of 0.050%), and Belgian (3.11, a difference of 0.060%).
| Demographics | Rating | Rank | Average Family Size |
| English | 0.0 /100 | #325 | Tragic 3.11 |
| Ottawa | 0.0 /100 | #326 | Tragic 3.11 |
| Dutch | 0.0 /100 | #327 | Tragic 3.11 |
| Czechs | 0.0 /100 | #328 | Tragic 3.11 |
| Belgians | 0.0 /100 | #329 | Tragic 3.11 |
| Latvians | 0.0 /100 | #330 | Tragic 3.11 |
| Scotch-Irish | 0.0 /100 | #331 | Tragic 3.11 |
| Scottish | 0.0 /100 | #332 | Tragic 3.11 |
| Estonians | 0.0 /100 | #333 | Tragic 3.10 |
| Lithuanians | 0.0 /100 | #334 | Tragic 3.10 |
| Luxembourgers | 0.0 /100 | #335 | Tragic 3.10 |
| Irish | 0.0 /100 | #336 | Tragic 3.10 |
| Swedes | 0.0 /100 | #337 | Tragic 3.10 |
| French | 0.0 /100 | #338 | Tragic 3.10 |
| Croatians | 0.0 /100 | #339 | Tragic 3.10 |