Immigrants from Kuwait vs Samoan Births to Unmarried Women
COMPARE
Immigrants from Kuwait
Samoan
Births to Unmarried Women
Births to Unmarried Women Comparison
Immigrants from Kuwait
Samoans
28.8%
BIRTHS TO UNMARRIED WOMEN
98.0/ 100
METRIC RATING
83rd/ 347
METRIC RANK
32.6%
BIRTHS TO UNMARRIED WOMEN
21.9/ 100
METRIC RATING
195th/ 347
METRIC RANK
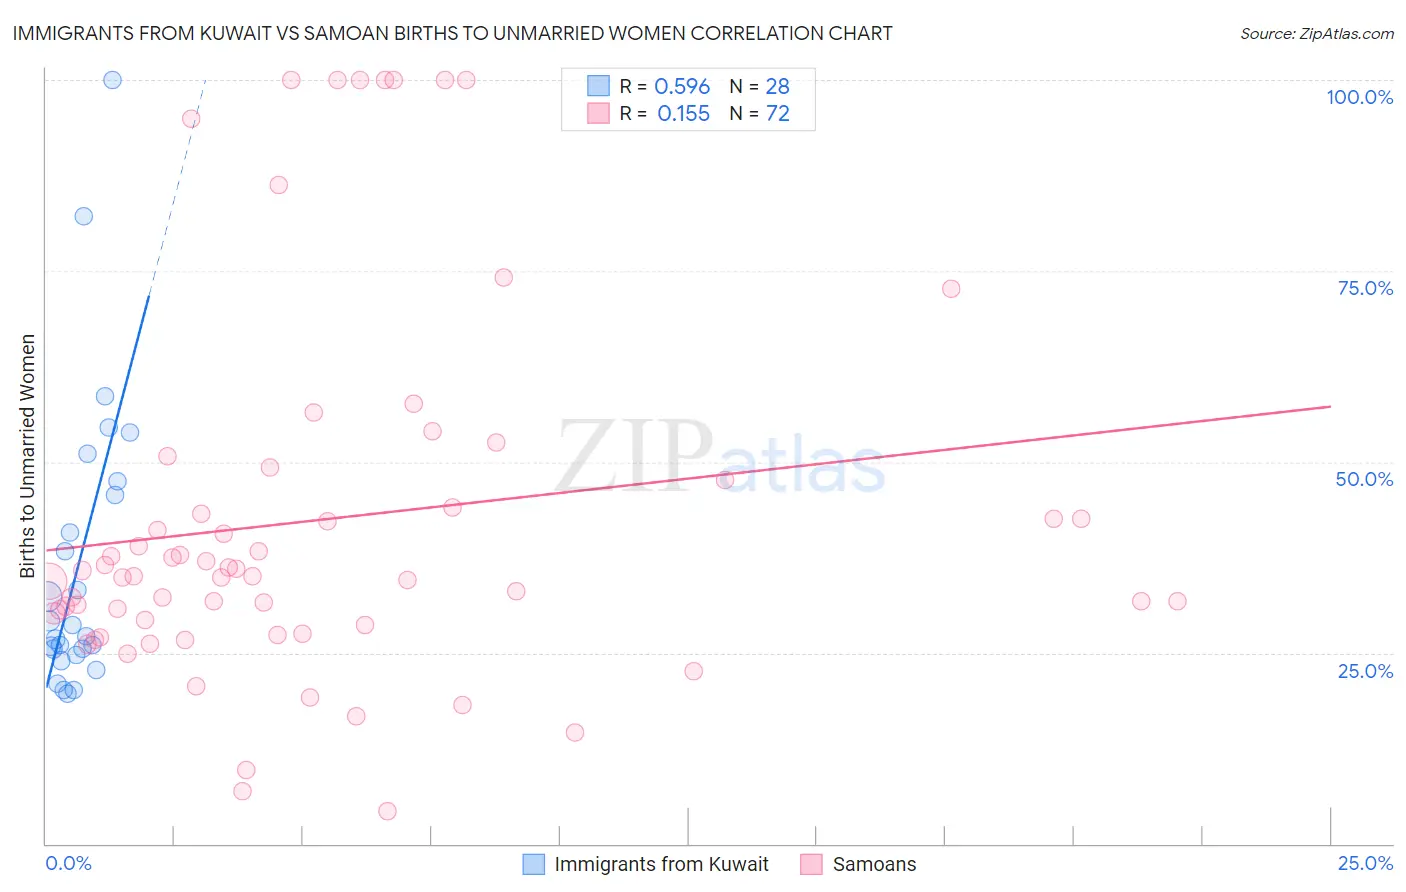
Immigrants from Kuwait vs Samoan Births to Unmarried Women Correlation Chart
The statistical analysis conducted on geographies consisting of 132,321,257 people shows a substantial positive correlation between the proportion of Immigrants from Kuwait and percentage of births to unmarried women in the United States with a correlation coefficient (R) of 0.596 and weighted average of 28.8%. Similarly, the statistical analysis conducted on geographies consisting of 217,867,082 people shows a poor positive correlation between the proportion of Samoans and percentage of births to unmarried women in the United States with a correlation coefficient (R) of 0.155 and weighted average of 32.6%, a difference of 13.4%.
Births to Unmarried Women Correlation Summary
| Measurement | Immigrants from Kuwait | Samoan |
| Minimum | 19.6% | 4.3% |
| Maximum | 100.0% | 100.0% |
| Range | 80.4% | 95.7% |
| Mean | 36.8% | 42.4% |
| Median | 27.9% | 35.0% |
| Interquartile 25% (IQ1) | 25.1% | 28.9% |
| Interquartile 75% (IQ3) | 46.5% | 45.8% |
| Interquartile Range (IQR) | 21.4% | 16.9% |
| Standard Deviation (Sample) | 19.3% | 24.4% |
| Standard Deviation (Population) | 19.0% | 24.2% |
Similar Demographics by Births to Unmarried Women
Demographics Similar to Immigrants from Kuwait by Births to Unmarried Women
In terms of births to unmarried women, the demographic groups most similar to Immigrants from Kuwait are Romanian (28.7%, a difference of 0.080%), Immigrants from Austria (28.7%, a difference of 0.18%), Immigrants from Afghanistan (28.7%, a difference of 0.23%), Danish (28.7%, a difference of 0.25%), and Zimbabwean (28.7%, a difference of 0.27%).
| Demographics | Rating | Rank | Births to Unmarried Women |
| Israelis | 98.4 /100 | #76 | Exceptional 28.6% |
| Immigrants | Northern Europe | 98.3 /100 | #77 | Exceptional 28.6% |
| Zimbabweans | 98.2 /100 | #78 | Exceptional 28.7% |
| Danes | 98.2 /100 | #79 | Exceptional 28.7% |
| Immigrants | Afghanistan | 98.1 /100 | #80 | Exceptional 28.7% |
| Immigrants | Austria | 98.1 /100 | #81 | Exceptional 28.7% |
| Romanians | 98.0 /100 | #82 | Exceptional 28.7% |
| Immigrants | Kuwait | 98.0 /100 | #83 | Exceptional 28.8% |
| Immigrants | Poland | 97.6 /100 | #84 | Exceptional 28.9% |
| Sri Lankans | 97.5 /100 | #85 | Exceptional 28.9% |
| Immigrants | Jordan | 97.4 /100 | #86 | Exceptional 29.0% |
| Taiwanese | 97.3 /100 | #87 | Exceptional 29.0% |
| Immigrants | France | 97.3 /100 | #88 | Exceptional 29.0% |
| Immigrants | Saudi Arabia | 97.0 /100 | #89 | Exceptional 29.1% |
| Immigrants | Latvia | 96.8 /100 | #90 | Exceptional 29.1% |
Demographics Similar to Samoans by Births to Unmarried Women
In terms of births to unmarried women, the demographic groups most similar to Samoans are Immigrants from Colombia (32.6%, a difference of 0.030%), Immigrants (32.7%, a difference of 0.18%), Costa Rican (32.7%, a difference of 0.23%), Immigrants from Thailand (32.8%, a difference of 0.43%), and Immigrants from Germany (32.8%, a difference of 0.44%).
| Demographics | Rating | Rank | Births to Unmarried Women |
| Osage | 37.1 /100 | #188 | Fair 32.1% |
| Immigrants | Kenya | 36.9 /100 | #189 | Fair 32.1% |
| Tlingit-Haida | 32.6 /100 | #190 | Fair 32.2% |
| Irish | 32.4 /100 | #191 | Fair 32.2% |
| Colombians | 31.9 /100 | #192 | Fair 32.2% |
| Fijians | 31.1 /100 | #193 | Fair 32.3% |
| Sudanese | 27.3 /100 | #194 | Fair 32.4% |
| Samoans | 21.9 /100 | #195 | Fair 32.6% |
| Immigrants | Colombia | 21.7 /100 | #196 | Fair 32.6% |
| Immigrants | Immigrants | 20.6 /100 | #197 | Fair 32.7% |
| Costa Ricans | 20.3 /100 | #198 | Fair 32.7% |
| Immigrants | Thailand | 18.9 /100 | #199 | Poor 32.8% |
| Immigrants | Germany | 18.8 /100 | #200 | Poor 32.8% |
| Immigrants | Burma/Myanmar | 16.7 /100 | #201 | Poor 32.9% |
| Immigrants | Micronesia | 16.6 /100 | #202 | Poor 32.9% |