Immigrants from Korea vs Immigrants from Zaire Births to Unmarried Women
COMPARE
Immigrants from Korea
Immigrants from Zaire
Births to Unmarried Women
Births to Unmarried Women Comparison
Immigrants from Korea
Immigrants from Zaire
26.3%
BIRTHS TO UNMARRIED WOMEN
99.9/ 100
METRIC RATING
20th/ 347
METRIC RANK
34.5%
BIRTHS TO UNMARRIED WOMEN
2.3/ 100
METRIC RATING
234th/ 347
METRIC RANK
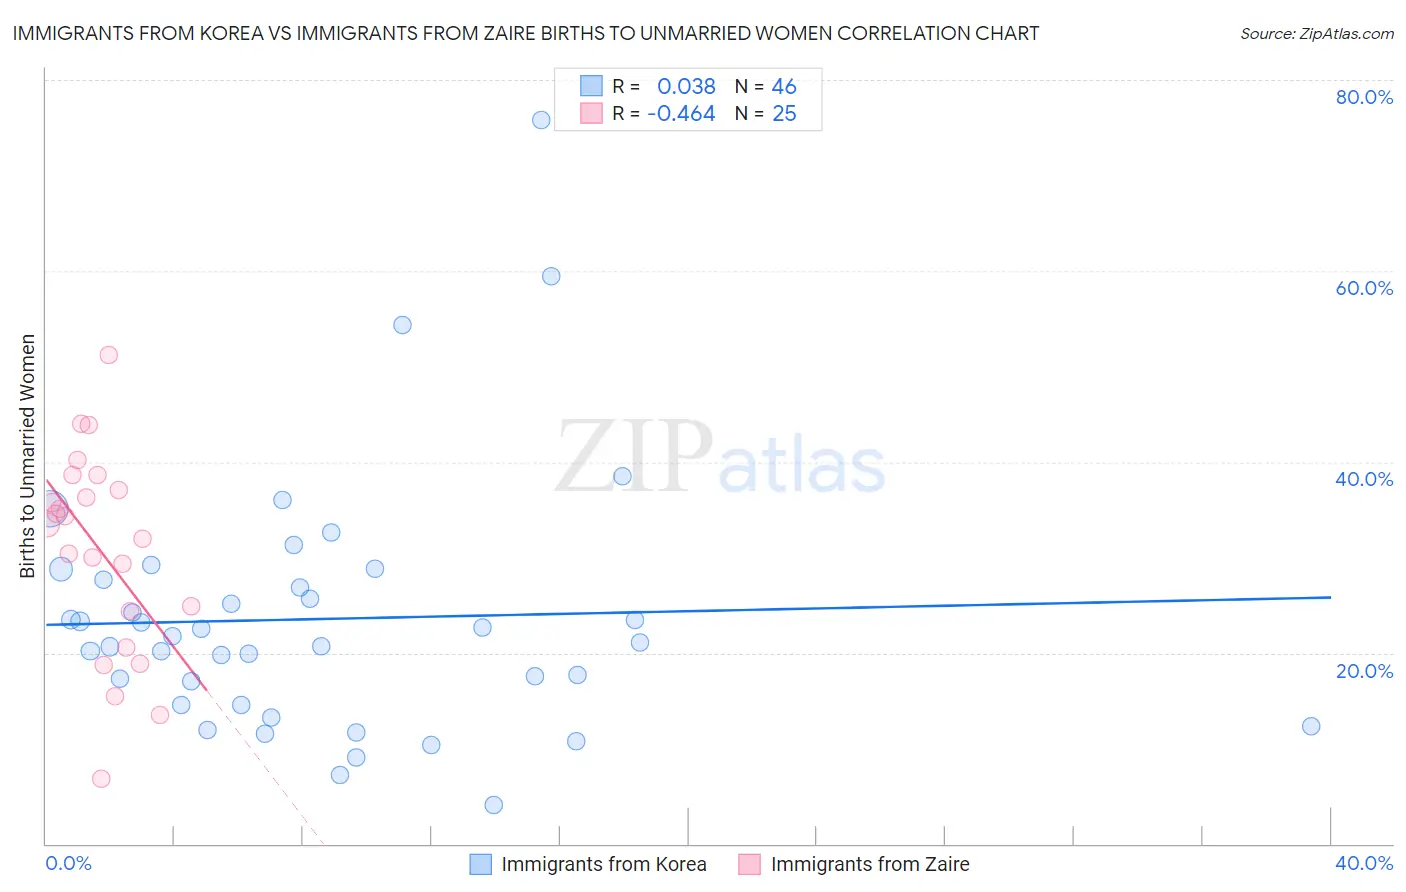
Immigrants from Korea vs Immigrants from Zaire Births to Unmarried Women Correlation Chart
The statistical analysis conducted on geographies consisting of 385,969,141 people shows no correlation between the proportion of Immigrants from Korea and percentage of births to unmarried women in the United States with a correlation coefficient (R) of 0.038 and weighted average of 26.3%. Similarly, the statistical analysis conducted on geographies consisting of 105,430,695 people shows a moderate negative correlation between the proportion of Immigrants from Zaire and percentage of births to unmarried women in the United States with a correlation coefficient (R) of -0.464 and weighted average of 34.5%, a difference of 31.3%.
Births to Unmarried Women Correlation Summary
| Measurement | Immigrants from Korea | Immigrants from Zaire |
| Minimum | 4.1% | 6.8% |
| Maximum | 75.8% | 51.2% |
| Range | 71.7% | 44.5% |
| Mean | 23.5% | 30.7% |
| Median | 21.4% | 33.4% |
| Interquartile 25% (IQ1) | 14.6% | 22.4% |
| Interquartile 75% (IQ3) | 27.6% | 37.8% |
| Interquartile Range (IQR) | 13.0% | 15.4% |
| Standard Deviation (Sample) | 13.3% | 10.6% |
| Standard Deviation (Population) | 13.2% | 10.4% |
Similar Demographics by Births to Unmarried Women
Demographics Similar to Immigrants from Korea by Births to Unmarried Women
In terms of births to unmarried women, the demographic groups most similar to Immigrants from Korea are Soviet Union (26.3%, a difference of 0.13%), Armenian (26.2%, a difference of 0.21%), Burmese (26.4%, a difference of 0.36%), Immigrants from Japan (26.4%, a difference of 0.55%), and Immigrants from Armenia (26.1%, a difference of 0.80%).
| Demographics | Rating | Rank | Births to Unmarried Women |
| Iranians | 100.0 /100 | #13 | Exceptional 25.3% |
| Immigrants | Lebanon | 100.0 /100 | #14 | Exceptional 25.3% |
| Immigrants | Singapore | 100.0 /100 | #15 | Exceptional 25.6% |
| Immigrants | Belarus | 100.0 /100 | #16 | Exceptional 25.6% |
| Immigrants | Uzbekistan | 100.0 /100 | #17 | Exceptional 25.8% |
| Immigrants | Armenia | 99.9 /100 | #18 | Exceptional 26.1% |
| Armenians | 99.9 /100 | #19 | Exceptional 26.2% |
| Immigrants | Korea | 99.9 /100 | #20 | Exceptional 26.3% |
| Soviet Union | 99.9 /100 | #21 | Exceptional 26.3% |
| Burmese | 99.9 /100 | #22 | Exceptional 26.4% |
| Immigrants | Japan | 99.9 /100 | #23 | Exceptional 26.4% |
| Immigrants | Australia | 99.9 /100 | #24 | Exceptional 26.6% |
| Cambodians | 99.9 /100 | #25 | Exceptional 26.7% |
| Asians | 99.9 /100 | #26 | Exceptional 26.8% |
| Immigrants | Asia | 99.9 /100 | #27 | Exceptional 26.8% |
Demographics Similar to Immigrants from Zaire by Births to Unmarried Women
In terms of births to unmarried women, the demographic groups most similar to Immigrants from Zaire are Immigrants from Ghana (34.5%, a difference of 0.070%), Bangladeshi (34.4%, a difference of 0.24%), French Canadian (34.4%, a difference of 0.26%), Native Hawaiian (34.3%, a difference of 0.56%), and Ghanaian (34.3%, a difference of 0.70%).
| Demographics | Rating | Rank | Births to Unmarried Women |
| Immigrants | Panama | 3.3 /100 | #227 | Tragic 34.2% |
| Panamanians | 3.3 /100 | #228 | Tragic 34.2% |
| Immigrants | Sierra Leone | 3.1 /100 | #229 | Tragic 34.2% |
| Ghanaians | 3.1 /100 | #230 | Tragic 34.3% |
| Native Hawaiians | 2.9 /100 | #231 | Tragic 34.3% |
| French Canadians | 2.5 /100 | #232 | Tragic 34.4% |
| Bangladeshis | 2.5 /100 | #233 | Tragic 34.4% |
| Immigrants | Zaire | 2.3 /100 | #234 | Tragic 34.5% |
| Immigrants | Ghana | 2.2 /100 | #235 | Tragic 34.5% |
| Immigrants | Cameroon | 1.6 /100 | #236 | Tragic 34.7% |
| Marshallese | 1.6 /100 | #237 | Tragic 34.8% |
| Immigrants | Cambodia | 1.6 /100 | #238 | Tragic 34.8% |
| Sierra Leoneans | 1.4 /100 | #239 | Tragic 34.9% |
| Immigrants | Middle Africa | 1.2 /100 | #240 | Tragic 34.9% |
| Immigrants | Guyana | 1.2 /100 | #241 | Tragic 35.0% |