Immigrants from Morocco vs Guamanian/Chamorro Single Mother Households
COMPARE
Immigrants from Morocco
Guamanian/Chamorro
Single Mother Households
Single Mother Households Comparison
Immigrants from Morocco
Guamanians/Chamorros
6.3%
SINGLE MOTHER HOUSEHOLDS
50.0/ 100
METRIC RATING
174th/ 347
METRIC RANK
6.6%
SINGLE MOTHER HOUSEHOLDS
12.4/ 100
METRIC RATING
202nd/ 347
METRIC RANK
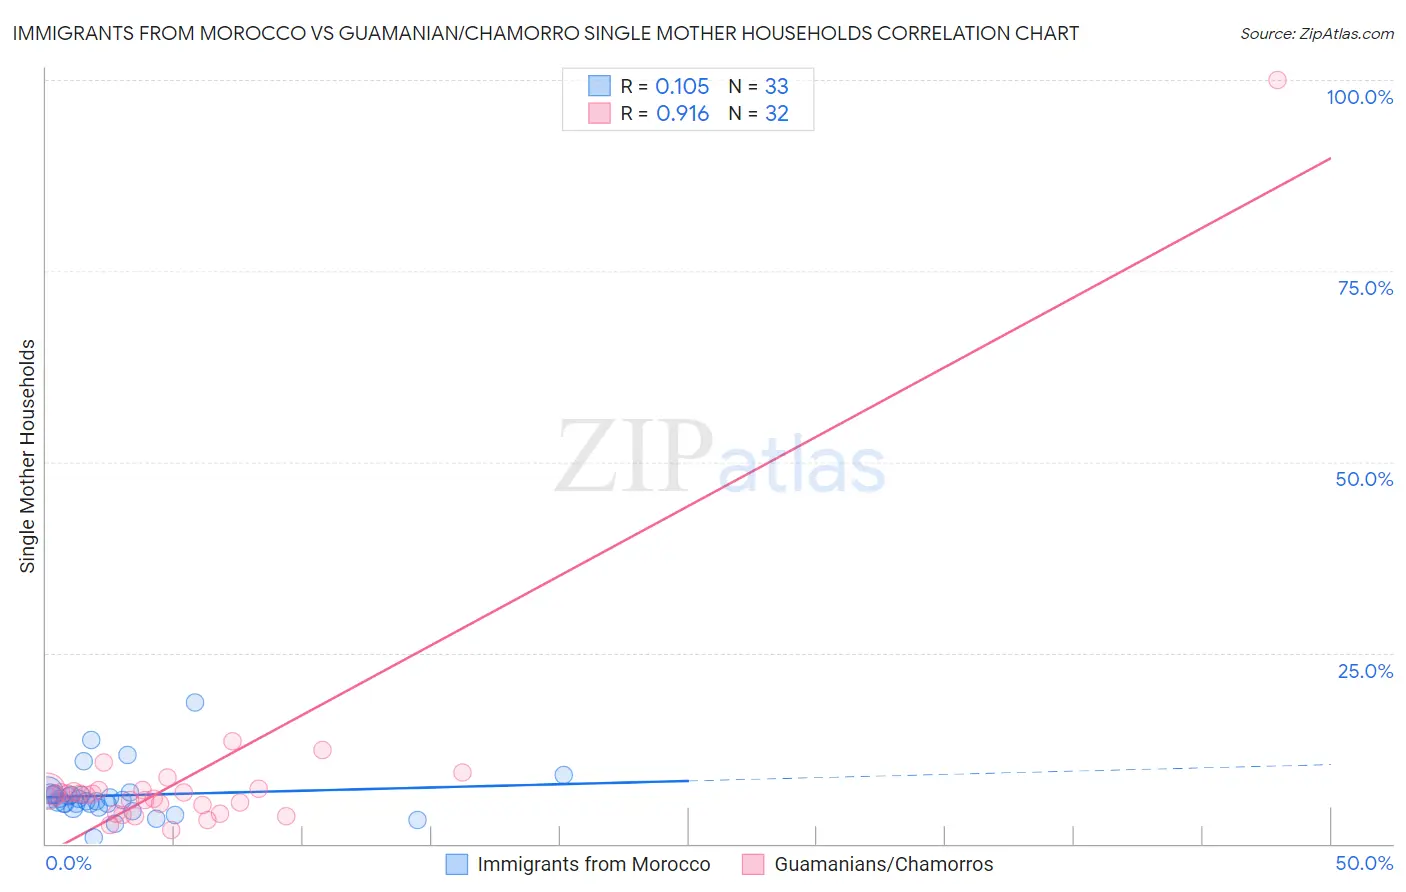
Immigrants from Morocco vs Guamanian/Chamorro Single Mother Households Correlation Chart
The statistical analysis conducted on geographies consisting of 178,813,452 people shows a poor positive correlation between the proportion of Immigrants from Morocco and percentage of single mother households in the United States with a correlation coefficient (R) of 0.105 and weighted average of 6.3%. Similarly, the statistical analysis conducted on geographies consisting of 221,648,092 people shows a near-perfect positive correlation between the proportion of Guamanians/Chamorros and percentage of single mother households in the United States with a correlation coefficient (R) of 0.916 and weighted average of 6.6%, a difference of 5.3%.
Single Mother Households Correlation Summary
| Measurement | Immigrants from Morocco | Guamanian/Chamorro |
| Minimum | 0.87% | 1.8% |
| Maximum | 18.5% | 100.0% |
| Range | 17.7% | 98.2% |
| Mean | 6.3% | 9.2% |
| Median | 5.8% | 6.4% |
| Interquartile 25% (IQ1) | 5.0% | 4.5% |
| Interquartile 75% (IQ3) | 6.5% | 7.1% |
| Interquartile Range (IQR) | 1.5% | 2.5% |
| Standard Deviation (Sample) | 3.3% | 16.8% |
| Standard Deviation (Population) | 3.2% | 16.5% |
Similar Demographics by Single Mother Households
Demographics Similar to Immigrants from Morocco by Single Mother Households
In terms of single mother households, the demographic groups most similar to Immigrants from Morocco are Immigrants from Vietnam (6.3%, a difference of 0.17%), Immigrants from South Eastern Asia (6.3%, a difference of 0.24%), Afghan (6.3%, a difference of 0.28%), Marshallese (6.3%, a difference of 0.46%), and Immigrants from Oceania (6.3%, a difference of 0.50%).
| Demographics | Rating | Rank | Single Mother Households |
| Brazilians | 59.1 /100 | #167 | Average 6.2% |
| Immigrants | Chile | 58.3 /100 | #168 | Average 6.3% |
| Puget Sound Salish | 58.1 /100 | #169 | Average 6.3% |
| Immigrants | Oceania | 54.6 /100 | #170 | Average 6.3% |
| Afghans | 52.5 /100 | #171 | Average 6.3% |
| Immigrants | South Eastern Asia | 52.2 /100 | #172 | Average 6.3% |
| Immigrants | Vietnam | 51.5 /100 | #173 | Average 6.3% |
| Immigrants | Morocco | 50.0 /100 | #174 | Average 6.3% |
| Marshallese | 45.8 /100 | #175 | Average 6.3% |
| Immigrants | Bosnia and Herzegovina | 44.3 /100 | #176 | Average 6.3% |
| Osage | 43.0 /100 | #177 | Average 6.4% |
| Portuguese | 40.0 /100 | #178 | Fair 6.4% |
| Hmong | 39.8 /100 | #179 | Fair 6.4% |
| Immigrants | Nepal | 36.1 /100 | #180 | Fair 6.4% |
| Spanish | 33.4 /100 | #181 | Fair 6.4% |
Demographics Similar to Guamanians/Chamorros by Single Mother Households
In terms of single mother households, the demographic groups most similar to Guamanians/Chamorros are Immigrants from Peru (6.7%, a difference of 0.090%), Immigrants from Fiji (6.7%, a difference of 0.11%), Venezuelan (6.6%, a difference of 0.12%), Cree (6.7%, a difference of 0.13%), and German Russian (6.7%, a difference of 0.21%).
| Demographics | Rating | Rank | Single Mother Households |
| South Americans | 18.0 /100 | #195 | Poor 6.6% |
| Uruguayans | 18.0 /100 | #196 | Poor 6.6% |
| Moroccans | 17.4 /100 | #197 | Poor 6.6% |
| Hawaiians | 16.1 /100 | #198 | Poor 6.6% |
| Potawatomi | 15.5 /100 | #199 | Poor 6.6% |
| Immigrants | Ethiopia | 14.7 /100 | #200 | Poor 6.6% |
| Venezuelans | 12.9 /100 | #201 | Poor 6.6% |
| Guamanians/Chamorros | 12.4 /100 | #202 | Poor 6.6% |
| Immigrants | Peru | 12.0 /100 | #203 | Poor 6.7% |
| Immigrants | Fiji | 11.9 /100 | #204 | Poor 6.7% |
| Cree | 11.9 /100 | #205 | Poor 6.7% |
| German Russians | 11.5 /100 | #206 | Poor 6.7% |
| Immigrants | South America | 11.5 /100 | #207 | Poor 6.7% |
| Vietnamese | 11.3 /100 | #208 | Poor 6.7% |
| Immigrants | Colombia | 10.5 /100 | #209 | Poor 6.7% |