Immigrants from Albania vs Guamanian/Chamorro Single Mother Households
COMPARE
Immigrants from Albania
Guamanian/Chamorro
Single Mother Households
Single Mother Households Comparison
Immigrants from Albania
Guamanians/Chamorros
6.1%
SINGLE MOTHER HOUSEHOLDS
81.5/ 100
METRIC RATING
149th/ 347
METRIC RANK
6.6%
SINGLE MOTHER HOUSEHOLDS
12.4/ 100
METRIC RATING
202nd/ 347
METRIC RANK
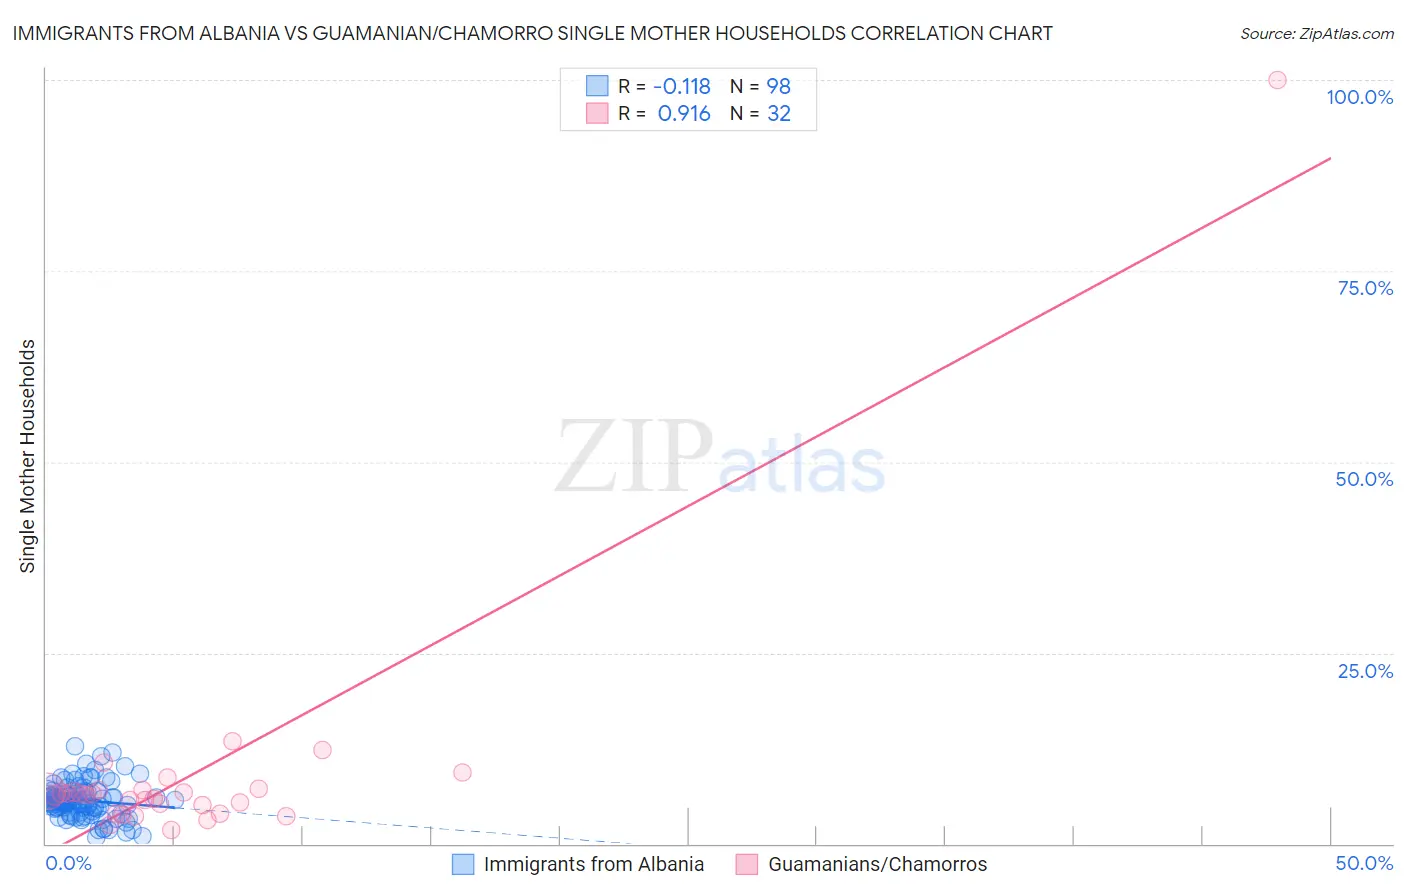
Immigrants from Albania vs Guamanian/Chamorro Single Mother Households Correlation Chart
The statistical analysis conducted on geographies consisting of 119,328,901 people shows a poor negative correlation between the proportion of Immigrants from Albania and percentage of single mother households in the United States with a correlation coefficient (R) of -0.118 and weighted average of 6.1%. Similarly, the statistical analysis conducted on geographies consisting of 221,648,092 people shows a near-perfect positive correlation between the proportion of Guamanians/Chamorros and percentage of single mother households in the United States with a correlation coefficient (R) of 0.916 and weighted average of 6.6%, a difference of 9.8%.
Single Mother Households Correlation Summary
| Measurement | Immigrants from Albania | Guamanian/Chamorro |
| Minimum | 0.85% | 1.8% |
| Maximum | 12.7% | 100.0% |
| Range | 11.9% | 98.2% |
| Mean | 5.7% | 9.2% |
| Median | 5.5% | 6.4% |
| Interquartile 25% (IQ1) | 4.2% | 4.5% |
| Interquartile 75% (IQ3) | 6.8% | 7.1% |
| Interquartile Range (IQR) | 2.6% | 2.5% |
| Standard Deviation (Sample) | 2.3% | 16.8% |
| Standard Deviation (Population) | 2.3% | 16.5% |
Similar Demographics by Single Mother Households
Demographics Similar to Immigrants from Albania by Single Mother Households
In terms of single mother households, the demographic groups most similar to Immigrants from Albania are Scotch-Irish (6.0%, a difference of 0.10%), Zimbabwean (6.1%, a difference of 0.14%), Immigrants from Jordan (6.0%, a difference of 0.15%), Immigrants from Southern Europe (6.1%, a difference of 0.19%), and French Canadian (6.0%, a difference of 0.21%).
| Demographics | Rating | Rank | Single Mother Households |
| Immigrants | Egypt | 85.0 /100 | #142 | Excellent 6.0% |
| Immigrants | Iraq | 84.8 /100 | #143 | Excellent 6.0% |
| Koreans | 84.4 /100 | #144 | Excellent 6.0% |
| Arabs | 84.0 /100 | #145 | Excellent 6.0% |
| French Canadians | 82.6 /100 | #146 | Excellent 6.0% |
| Immigrants | Jordan | 82.3 /100 | #147 | Excellent 6.0% |
| Scotch-Irish | 82.0 /100 | #148 | Excellent 6.0% |
| Immigrants | Albania | 81.5 /100 | #149 | Excellent 6.1% |
| Zimbabweans | 80.7 /100 | #150 | Excellent 6.1% |
| Immigrants | Southern Europe | 80.5 /100 | #151 | Excellent 6.1% |
| Pakistanis | 79.2 /100 | #152 | Good 6.1% |
| Immigrants | Brazil | 78.9 /100 | #153 | Good 6.1% |
| Immigrants | Philippines | 78.5 /100 | #154 | Good 6.1% |
| Whites/Caucasians | 76.5 /100 | #155 | Good 6.1% |
| Native Hawaiians | 75.0 /100 | #156 | Good 6.1% |
Demographics Similar to Guamanians/Chamorros by Single Mother Households
In terms of single mother households, the demographic groups most similar to Guamanians/Chamorros are Immigrants from Peru (6.7%, a difference of 0.090%), Immigrants from Fiji (6.7%, a difference of 0.11%), Venezuelan (6.6%, a difference of 0.12%), Cree (6.7%, a difference of 0.13%), and German Russian (6.7%, a difference of 0.21%).
| Demographics | Rating | Rank | Single Mother Households |
| South Americans | 18.0 /100 | #195 | Poor 6.6% |
| Uruguayans | 18.0 /100 | #196 | Poor 6.6% |
| Moroccans | 17.4 /100 | #197 | Poor 6.6% |
| Hawaiians | 16.1 /100 | #198 | Poor 6.6% |
| Potawatomi | 15.5 /100 | #199 | Poor 6.6% |
| Immigrants | Ethiopia | 14.7 /100 | #200 | Poor 6.6% |
| Venezuelans | 12.9 /100 | #201 | Poor 6.6% |
| Guamanians/Chamorros | 12.4 /100 | #202 | Poor 6.6% |
| Immigrants | Peru | 12.0 /100 | #203 | Poor 6.7% |
| Immigrants | Fiji | 11.9 /100 | #204 | Poor 6.7% |
| Cree | 11.9 /100 | #205 | Poor 6.7% |
| German Russians | 11.5 /100 | #206 | Poor 6.7% |
| Immigrants | South America | 11.5 /100 | #207 | Poor 6.7% |
| Vietnamese | 11.3 /100 | #208 | Poor 6.7% |
| Immigrants | Colombia | 10.5 /100 | #209 | Poor 6.7% |