Immigrants from Kazakhstan vs Immigrants from Western Asia Single Mother Households
COMPARE
Immigrants from Kazakhstan
Immigrants from Western Asia
Single Mother Households
Single Mother Households Comparison
Immigrants from Kazakhstan
Immigrants from Western Asia
5.6%
SINGLE MOTHER HOUSEHOLDS
98.4/ 100
METRIC RATING
71st/ 347
METRIC RANK
5.7%
SINGLE MOTHER HOUSEHOLDS
96.7/ 100
METRIC RATING
92nd/ 347
METRIC RANK
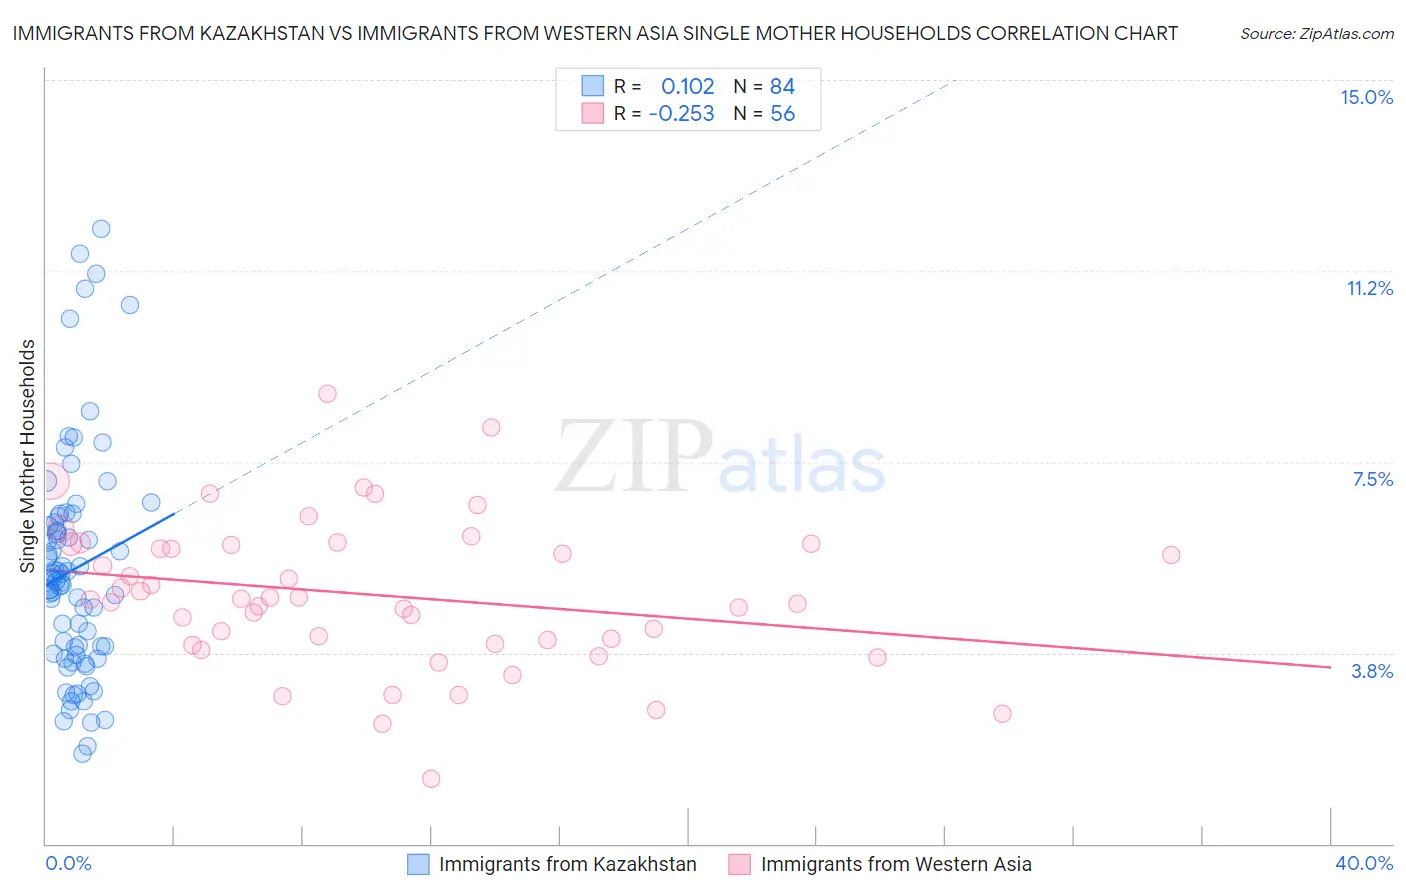
Immigrants from Kazakhstan vs Immigrants from Western Asia Single Mother Households Correlation Chart
The statistical analysis conducted on geographies consisting of 124,312,520 people shows a poor positive correlation between the proportion of Immigrants from Kazakhstan and percentage of single mother households in the United States with a correlation coefficient (R) of 0.102 and weighted average of 5.6%. Similarly, the statistical analysis conducted on geographies consisting of 403,187,700 people shows a weak negative correlation between the proportion of Immigrants from Western Asia and percentage of single mother households in the United States with a correlation coefficient (R) of -0.253 and weighted average of 5.7%, a difference of 2.3%.
Single Mother Households Correlation Summary
| Measurement | Immigrants from Kazakhstan | Immigrants from Western Asia |
| Minimum | 1.8% | 1.3% |
| Maximum | 12.1% | 8.8% |
| Range | 10.3% | 7.6% |
| Mean | 5.4% | 4.9% |
| Median | 5.2% | 4.8% |
| Interquartile 25% (IQ1) | 3.8% | 4.0% |
| Interquartile 75% (IQ3) | 6.3% | 5.9% |
| Interquartile Range (IQR) | 2.5% | 1.9% |
| Standard Deviation (Sample) | 2.2% | 1.5% |
| Standard Deviation (Population) | 2.2% | 1.4% |
Similar Demographics by Single Mother Households
Demographics Similar to Immigrants from Kazakhstan by Single Mother Households
In terms of single mother households, the demographic groups most similar to Immigrants from Kazakhstan are Immigrants from Eastern Europe (5.6%, a difference of 0.010%), Asian (5.6%, a difference of 0.080%), Immigrants from Netherlands (5.6%, a difference of 0.090%), Immigrants from Bulgaria (5.6%, a difference of 0.11%), and Immigrants from Asia (5.6%, a difference of 0.15%).
| Demographics | Rating | Rank | Single Mother Households |
| Immigrants | France | 98.6 /100 | #64 | Exceptional 5.6% |
| Greeks | 98.6 /100 | #65 | Exceptional 5.6% |
| Immigrants | Canada | 98.5 /100 | #66 | Exceptional 5.6% |
| Italians | 98.5 /100 | #67 | Exceptional 5.6% |
| Immigrants | Bulgaria | 98.5 /100 | #68 | Exceptional 5.6% |
| Asians | 98.5 /100 | #69 | Exceptional 5.6% |
| Immigrants | Eastern Europe | 98.4 /100 | #70 | Exceptional 5.6% |
| Immigrants | Kazakhstan | 98.4 /100 | #71 | Exceptional 5.6% |
| Immigrants | Netherlands | 98.4 /100 | #72 | Exceptional 5.6% |
| Immigrants | Asia | 98.4 /100 | #73 | Exceptional 5.6% |
| Immigrants | North America | 98.3 /100 | #74 | Exceptional 5.6% |
| Slovenes | 98.3 /100 | #75 | Exceptional 5.6% |
| New Zealanders | 98.2 /100 | #76 | Exceptional 5.6% |
| Romanians | 98.1 /100 | #77 | Exceptional 5.6% |
| Swiss | 98.1 /100 | #78 | Exceptional 5.6% |
Demographics Similar to Immigrants from Western Asia by Single Mother Households
In terms of single mother households, the demographic groups most similar to Immigrants from Western Asia are Serbian (5.7%, a difference of 0.010%), Basque (5.7%, a difference of 0.060%), Slovak (5.7%, a difference of 0.12%), European (5.7%, a difference of 0.23%), and Austrian (5.7%, a difference of 0.27%).
| Demographics | Rating | Rank | Single Mother Households |
| Hungarians | 97.6 /100 | #85 | Exceptional 5.7% |
| Finns | 97.6 /100 | #86 | Exceptional 5.7% |
| Immigrants | Turkey | 97.5 /100 | #87 | Exceptional 5.7% |
| Israelis | 97.4 /100 | #88 | Exceptional 5.7% |
| Ukrainians | 97.2 /100 | #89 | Exceptional 5.7% |
| Immigrants | Indonesia | 97.2 /100 | #90 | Exceptional 5.7% |
| Europeans | 97.0 /100 | #91 | Exceptional 5.7% |
| Immigrants | Western Asia | 96.7 /100 | #92 | Exceptional 5.7% |
| Serbians | 96.7 /100 | #93 | Exceptional 5.7% |
| Basques | 96.7 /100 | #94 | Exceptional 5.7% |
| Slovaks | 96.6 /100 | #95 | Exceptional 5.7% |
| Austrians | 96.4 /100 | #96 | Exceptional 5.7% |
| Tlingit-Haida | 96.4 /100 | #97 | Exceptional 5.7% |
| Immigrants | South Africa | 96.3 /100 | #98 | Exceptional 5.7% |
| Immigrants | Poland | 96.3 /100 | #99 | Exceptional 5.8% |