Immigrants from Kazakhstan vs Immigrants from Honduras Single Mother Households

COMPARE

Immigrants from Kazakhstan
Race
Ancestry
AfghanAfricanAlaska NativeAlaskan AthabascanAlbanianAleutAlsatianAmericanApacheArabArapahoArgentineanArmenianAssyrian/Chaldean/SyriacAustralianAustrianBahamianBangladeshiBarbadianBasqueBelgianBelizeanBermudanBhutaneseBlackfeetBolivianBrazilianBritishBritish West IndianBulgarianBurmeseCajunCambodianCanadianCape VerdeanCarpatho RusynCelticCentral AmericanCentral American IndianCherokeeCheyenneChickasawChileanChineseChippewaChoctawColombianColvilleComancheCosta RicanCreeCreekCroatianCrowCubanCypriotCzechCzechoslovakianDanishDelawareDominicanDutchDutch West IndianEastern EuropeanEcuadorianEgyptianEnglishEstonianEthiopianEuropeanFijianFilipinoFinnishFrenchFrench American IndianFrench CanadianGermanGerman RussianGhanaianGreekGuamanian/ChamorroGuatemalanGuyaneseHaitianHmongHonduranHopiHoumaHungarianIcelanderIndian (Asian)IndonesianInupiatIranianIraqiIrishIroquoisIsraeliItalianJamaicanJapaneseJordanianKenyanKiowaKoreanLaotianLatvianLebaneseLiberianLithuanianLumbeeLuxembourgerMacedonianMalaysianMalteseMarshalleseMenomineeMexicanMexican American IndianMongolianMoroccanNative HawaiianNavajoNepaleseNew ZealanderNicaraguanNigerianNorthern EuropeanNorwegianOkinawanOsageOttawaPaiutePakistaniPalestinianPanamanianParaguayanPennsylvania GermanPeruvianPimaPolishPortuguesePotawatomiPuebloPuerto RicanPuget Sound SalishRomanianRussianSalvadoranSamoanScandinavianScotch-IrishScottishSeminoleSenegaleseSerbianShoshoneSierra LeoneanSiouxSlavicSlovakSloveneSomaliSouth AfricanSouth AmericanSouth American IndianSoviet UnionSpaniardSpanishSpanish AmericanSpanish American IndianSri LankanSubsaharan AfricanSudaneseSwedishSwissSyrianTaiwaneseThaiTlingit-HaidaTohono O'OdhamTonganTrinidadian and TobagonianTsimshianTurkishU.S. Virgin IslanderUgandanUkrainianUruguayanUteVenezuelanVietnameseWelshWest IndianYakamaYaquiYugoslavianYumanYup'ikZimbabwean
Immigration
NonimmigrantsImmigrantsAfghanistanAfricaAlbaniaArgentinaArmeniaAsiaAustraliaAustriaBahamasBangladeshBarbadosBelarusBelgiumBelizeBoliviaBosnia and HerzegovinaBrazilBulgariaBurma/MyanmarCabo VerdeCambodiaCameroonCanadaCaribbeanCentral AmericaChileChinaColombiaCongoCosta RicaCroatiaCubaCzechoslovakiaDenmarkDominicaDominican RepublicEastern AfricaEastern AsiaEastern EuropeEcuadorEgyptEl SalvadorEnglandEritreaEthiopiaEuropeFijiFranceGermanyGhanaGreeceGrenadaGuatemalaGuyanaHaitiHong KongHungaryIndiaIndonesiaIranIraqIrelandIsraelItalyJamaicaJapanJordanKazakhstanKenyaKoreaKuwaitLaosLatin AmericaLatviaLebanonLiberiaLithuaniaMalaysiaMexicoMicronesiaMiddle AfricaMoldovaMoroccoNepalNetherlandsNicaraguaNigeriaNorth AmericaNorth MacedoniaNorthern AfricaNorthern EuropeNorwayOceaniaPakistanPanamaPeruPhilippinesPolandPortugalRomaniaRussiaSaudi ArabiaScotlandSenegalSerbiaSierra LeoneSingaporeSomaliaSouth AfricaSouth AmericaSouth Central AsiaSouth Eastern AsiaSouthern EuropeSpainSri LankaSt. Vincent and the GrenadinesSudanSwedenSwitzerlandSyriaTaiwanThailandTrinidad and TobagoTurkeyUgandaUkraineUruguayUzbekistanVenezuelaVietnamWest IndiesWestern AfricaWestern AsiaWestern EuropeYemenZaireZimbabweAzores
Immigrants from Honduras
Race
Ancestry
AfghanAfricanAlaska NativeAlaskan AthabascanAlbanianAleutAlsatianAmericanApacheArabArapahoArgentineanArmenianAssyrian/Chaldean/SyriacAustralianAustrianBahamianBangladeshiBarbadianBasqueBelgianBelizeanBermudanBhutaneseBlackfeetBolivianBrazilianBritishBritish West IndianBulgarianBurmeseCajunCambodianCanadianCape VerdeanCarpatho RusynCelticCentral AmericanCentral American IndianCherokeeCheyenneChickasawChileanChineseChippewaChoctawColombianColvilleComancheCosta RicanCreeCreekCroatianCrowCubanCypriotCzechCzechoslovakianDanishDelawareDominicanDutchDutch West IndianEastern EuropeanEcuadorianEgyptianEnglishEstonianEthiopianEuropeanFijianFilipinoFinnishFrenchFrench American IndianFrench CanadianGermanGerman RussianGhanaianGreekGuamanian/ChamorroGuatemalanGuyaneseHaitianHmongHonduranHopiHoumaHungarianIcelanderIndian (Asian)IndonesianInupiatIranianIraqiIrishIroquoisIsraeliItalianJamaicanJapaneseJordanianKenyanKiowaKoreanLaotianLatvianLebaneseLiberianLithuanianLumbeeLuxembourgerMacedonianMalaysianMalteseMarshalleseMenomineeMexicanMexican American IndianMongolianMoroccanNative HawaiianNavajoNepaleseNew ZealanderNicaraguanNigerianNorthern EuropeanNorwegianOkinawanOsageOttawaPaiutePakistaniPalestinianPanamanianParaguayanPennsylvania GermanPeruvianPimaPolishPortuguesePotawatomiPuebloPuerto RicanPuget Sound SalishRomanianRussianSalvadoranSamoanScandinavianScotch-IrishScottishSeminoleSenegaleseSerbianShoshoneSierra LeoneanSiouxSlavicSlovakSloveneSomaliSouth AfricanSouth AmericanSouth American IndianSoviet UnionSpaniardSpanishSpanish AmericanSpanish American IndianSri LankanSubsaharan AfricanSudaneseSwedishSwissSyrianTaiwaneseThaiTlingit-HaidaTohono O'OdhamTonganTrinidadian and TobagonianTsimshianTurkishU.S. Virgin IslanderUgandanUkrainianUruguayanUteVenezuelanVietnameseWelshWest IndianYakamaYaquiYugoslavianYumanYup'ikZimbabwean
Immigration
NonimmigrantsImmigrantsAfghanistanAfricaAlbaniaArgentinaArmeniaAsiaAustraliaAustriaBahamasBangladeshBarbadosBelarusBelgiumBelizeBoliviaBosnia and HerzegovinaBrazilBulgariaBurma/MyanmarCabo VerdeCambodiaCameroonCanadaCaribbeanCentral AmericaChileChinaColombiaCongoCosta RicaCroatiaCubaCzechoslovakiaDenmarkDominicaDominican RepublicEastern AfricaEastern AsiaEastern EuropeEcuadorEgyptEl SalvadorEnglandEritreaEthiopiaEuropeFijiFranceGermanyGhanaGreeceGrenadaGuatemalaGuyanaHaitiHondurasHong KongHungaryIndiaIndonesiaIranIraqIrelandIsraelItalyJamaicaJapanJordanKenyaKoreaKuwaitLaosLatin AmericaLatviaLebanonLiberiaLithuaniaMalaysiaMexicoMicronesiaMiddle AfricaMoldovaMoroccoNepalNetherlandsNicaraguaNigeriaNorth AmericaNorth MacedoniaNorthern AfricaNorthern EuropeNorwayOceaniaPakistanPanamaPeruPhilippinesPolandPortugalRomaniaRussiaSaudi ArabiaScotlandSenegalSerbiaSierra LeoneSingaporeSomaliaSouth AfricaSouth AmericaSouth Central AsiaSouth Eastern AsiaSouthern EuropeSpainSri LankaSt. Vincent and the GrenadinesSudanSwedenSwitzerlandSyriaTaiwanThailandTrinidad and TobagoTurkeyUgandaUkraineUruguayUzbekistanVenezuelaVietnamWest IndiesWestern AfricaWestern AsiaWestern EuropeYemenZaireZimbabweAzores
Single Mother Households
Income
Poverty
Unemployment
Labor Participation
Family Structure
Vehicle Availability
Education Level
Disability

Single Mother Households Comparison

Immigrants from Kazakhstan

Immigrants from Honduras

Exceptional
Tragic
5.6%
SINGLE MOTHER HOUSEHOLDS
98.4/ 100
METRIC RATING
71st/ 347
METRIC RANK
8.2%
SINGLE MOTHER HOUSEHOLDS
0.0/ 100
METRIC RATING
317th/ 347
METRIC RANK

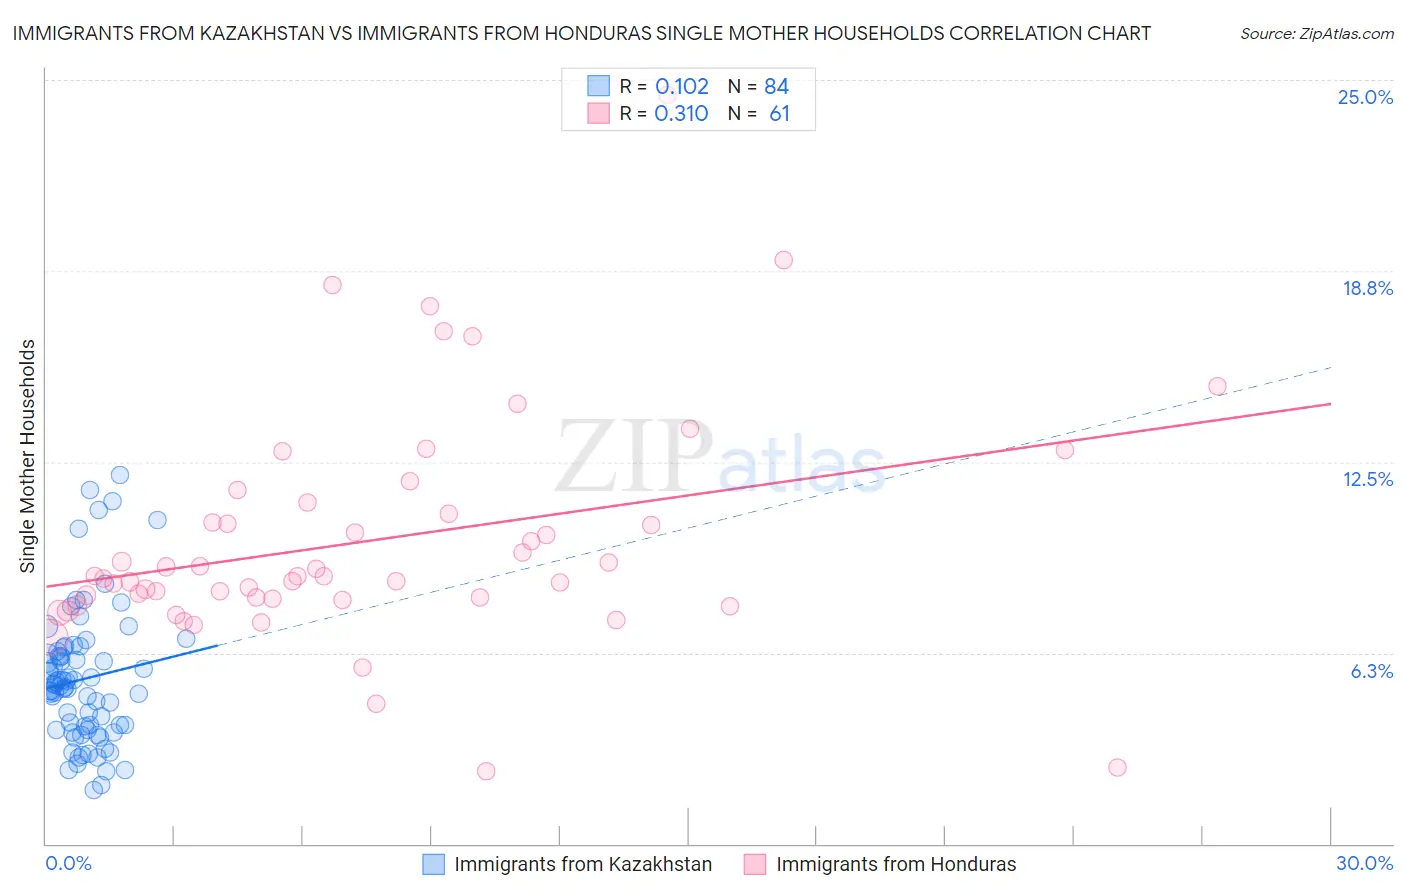
Immigrants from Kazakhstan vs Immigrants from Honduras Single Mother Households Correlation Chart

The statistical analysis conducted on geographies consisting of 124,312,520 people shows a poor positive correlation between the proportion of Immigrants from Kazakhstan and percentage of single mother households in the United States with a correlation coefficient (R) of 0.102 and weighted average of 5.6%. Similarly, the statistical analysis conducted on geographies consisting of 322,086,026 people shows a mild positive correlation between the proportion of Immigrants from Honduras and percentage of single mother households in the United States with a correlation coefficient (R) of 0.310 and weighted average of 8.2%, a difference of 46.3%.
Immigrants from Kazakhstan vs Immigrants from Honduras Single Mother Households

Single Mother Households Correlation Summary

MeasurementImmigrants from KazakhstanImmigrants from Honduras
Minimum1.8%2.4%
Maximum12.1%24.5%
Range10.3%22.1%
Mean5.4%9.9%
Median5.2%8.8%
Interquartile 25% (IQ1)3.8%8.0%
Interquartile 75% (IQ3)6.3%11.0%
Interquartile Range (IQR)2.5%3.0%
Standard Deviation (Sample)2.2%3.8%
Standard Deviation (Population)2.2%3.8%

Similar Demographics by Single Mother Households

Demographics Similar to Immigrants from Kazakhstan by Single Mother Households

In terms of single mother households, the demographic groups most similar to Immigrants from Kazakhstan are Immigrants from Eastern Europe (5.6%, a difference of 0.010%), Asian (5.6%, a difference of 0.080%), Immigrants from Netherlands (5.6%, a difference of 0.090%), Immigrants from Bulgaria (5.6%, a difference of 0.11%), and Immigrants from Asia (5.6%, a difference of 0.15%).
DemographicsRating | RankSingle Mother Households
Immigrants | France
98.6
/100
|
#64
Exceptional
5.6%
Greeks
98.6
/100
|
#65
Exceptional
5.6%
Immigrants | Canada
98.5
/100
|
#66
Exceptional
5.6%
Italians
98.5
/100
|
#67
Exceptional
5.6%
Immigrants | Bulgaria
98.5
/100
|
#68
Exceptional
5.6%
Asians
98.5
/100
|
#69
Exceptional
5.6%
Immigrants | Eastern Europe
98.4
/100
|
#70
Exceptional
5.6%
Immigrants | Kazakhstan
98.4
/100
|
#71
Exceptional
5.6%
Immigrants | Netherlands
98.4
/100
|
#72
Exceptional
5.6%
Immigrants | Asia
98.4
/100
|
#73
Exceptional
5.6%
Immigrants | North America
98.3
/100
|
#74
Exceptional
5.6%
Slovenes
98.3
/100
|
#75
Exceptional
5.6%
New Zealanders
98.2
/100
|
#76
Exceptional
5.6%
Romanians
98.1
/100
|
#77
Exceptional
5.6%
Swiss
98.1
/100
|
#78
Exceptional
5.6%

Demographics Similar to Immigrants from Honduras by Single Mother Households

In terms of single mother households, the demographic groups most similar to Immigrants from Honduras are African (8.2%, a difference of 0.14%), Immigrants from Western Africa (8.2%, a difference of 0.28%), Immigrants from Mexico (8.2%, a difference of 0.31%), Immigrants from Grenada (8.2%, a difference of 0.43%), and Senegalese (8.2%, a difference of 0.56%).
DemographicsRating | RankSingle Mother Households
Hondurans
0.0
/100
|
#310
Tragic
8.1%
Immigrants | Congo
0.0
/100
|
#311
Tragic
8.1%
Bangladeshis
0.0
/100
|
#312
Tragic
8.1%
Immigrants | Grenada
0.0
/100
|
#313
Tragic
8.2%
Immigrants | Mexico
0.0
/100
|
#314
Tragic
8.2%
Immigrants | Western Africa
0.0
/100
|
#315
Tragic
8.2%
Africans
0.0
/100
|
#316
Tragic
8.2%
Immigrants | Honduras
0.0
/100
|
#317
Tragic
8.2%
Senegalese
0.0
/100
|
#318
Tragic
8.2%
Jamaicans
0.0
/100
|
#319
Tragic
8.2%
Bahamians
0.0
/100
|
#320
Tragic
8.3%
Immigrants | Senegal
0.0
/100
|
#321
Tragic
8.3%
Pima
0.0
/100
|
#322
Tragic
8.3%
Haitians
0.0
/100
|
#323
Tragic
8.3%
Immigrants | Jamaica
0.0
/100
|
#324
Tragic
8.4%