Immigrants from Kazakhstan vs Nicaraguan Average Family Size
COMPARE
Immigrants from Kazakhstan
Nicaraguan
Average Family Size
Average Family Size Comparison
Immigrants from Kazakhstan
Nicaraguans
3.17
AVERAGE FAMILY SIZE
1.5/ 100
METRIC RATING
256th/ 347
METRIC RANK
3.36
AVERAGE FAMILY SIZE
100.0/ 100
METRIC RATING
51st/ 347
METRIC RANK
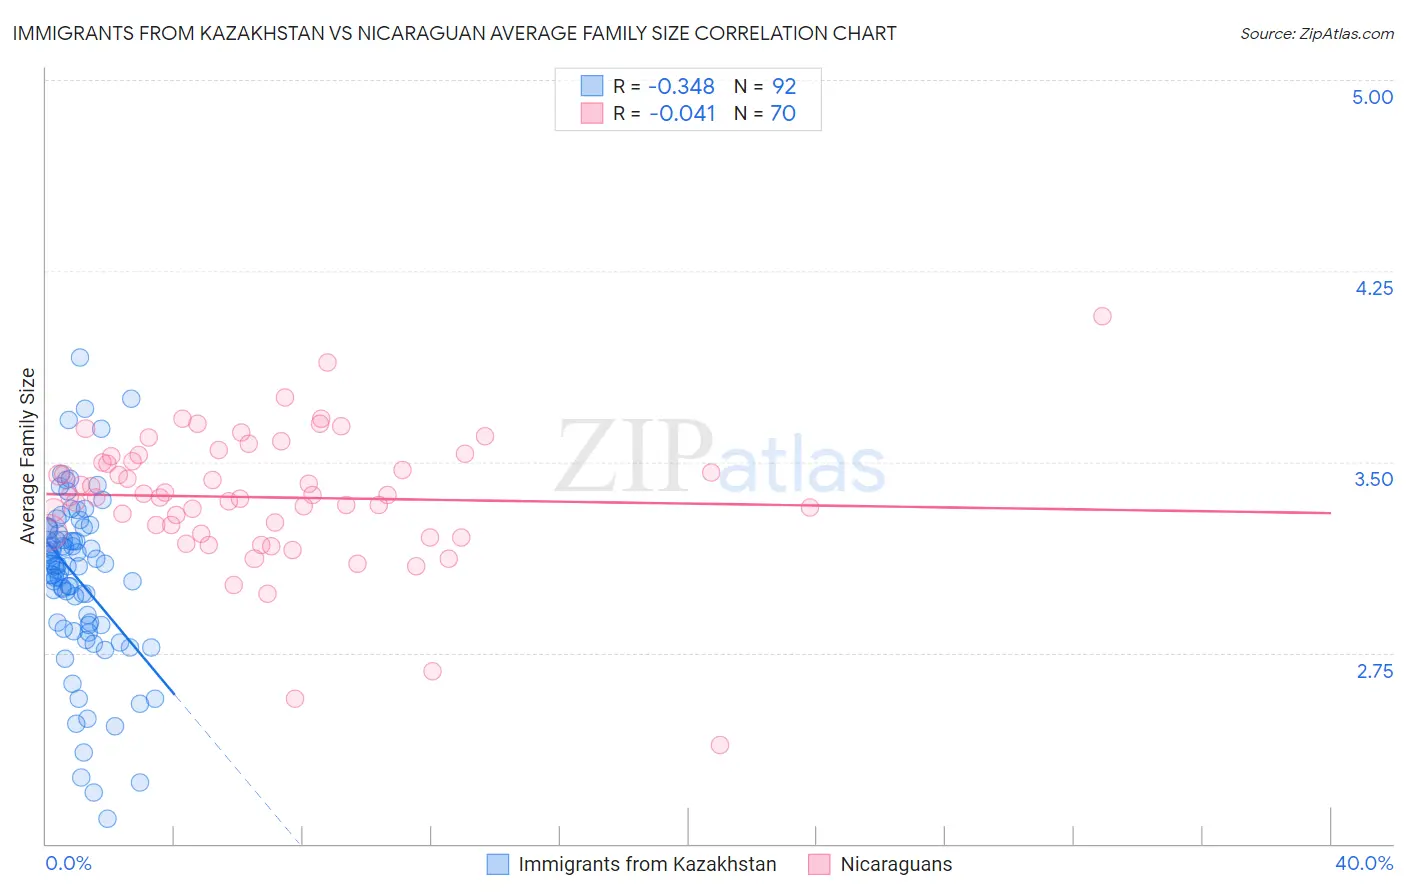
Immigrants from Kazakhstan vs Nicaraguan Average Family Size Correlation Chart
The statistical analysis conducted on geographies consisting of 124,429,118 people shows a mild negative correlation between the proportion of Immigrants from Kazakhstan and average family size in the United States with a correlation coefficient (R) of -0.348 and weighted average of 3.17. Similarly, the statistical analysis conducted on geographies consisting of 285,625,461 people shows no correlation between the proportion of Nicaraguans and average family size in the United States with a correlation coefficient (R) of -0.041 and weighted average of 3.36, a difference of 6.1%.
Average Family Size Correlation Summary
| Measurement | Immigrants from Kazakhstan | Nicaraguan |
| Minimum | 2.10 | 2.39 |
| Maximum | 3.91 | 4.07 |
| Range | 1.81 | 1.68 |
| Mean | 3.04 | 3.36 |
| Median | 3.09 | 3.37 |
| Interquartile 25% (IQ1) | 2.86 | 3.22 |
| Interquartile 75% (IQ3) | 3.23 | 3.52 |
| Interquartile Range (IQR) | 0.37 | 0.30 |
| Standard Deviation (Sample) | 0.34 | 0.26 |
| Standard Deviation (Population) | 0.33 | 0.26 |
Similar Demographics by Average Family Size
Demographics Similar to Immigrants from Kazakhstan by Average Family Size
In terms of average family size, the demographic groups most similar to Immigrants from Kazakhstan are Albanian (3.17, a difference of 0.020%), Cape Verdean (3.17, a difference of 0.030%), South African (3.17, a difference of 0.040%), Immigrants from Hungary (3.17, a difference of 0.040%), and Immigrants from Saudi Arabia (3.17, a difference of 0.050%).
| Demographics | Rating | Rank | Average Family Size |
| Immigrants | Eastern Europe | 2.1 /100 | #249 | Tragic 3.17 |
| Puget Sound Salish | 1.9 /100 | #250 | Tragic 3.17 |
| Immigrants | Spain | 1.8 /100 | #251 | Tragic 3.17 |
| Immigrants | Saudi Arabia | 1.7 /100 | #252 | Tragic 3.17 |
| South Africans | 1.7 /100 | #253 | Tragic 3.17 |
| Immigrants | Hungary | 1.7 /100 | #254 | Tragic 3.17 |
| Cape Verdeans | 1.6 /100 | #255 | Tragic 3.17 |
| Immigrants | Kazakhstan | 1.5 /100 | #256 | Tragic 3.17 |
| Albanians | 1.5 /100 | #257 | Tragic 3.17 |
| Turks | 1.3 /100 | #258 | Tragic 3.16 |
| Potawatomi | 1.3 /100 | #259 | Tragic 3.16 |
| Immigrants | Albania | 1.3 /100 | #260 | Tragic 3.16 |
| Immigrants | North Macedonia | 1.3 /100 | #261 | Tragic 3.16 |
| Immigrants | Russia | 1.3 /100 | #262 | Tragic 3.16 |
| Immigrants | Bulgaria | 1.0 /100 | #263 | Tragic 3.16 |
Demographics Similar to Nicaraguans by Average Family Size
In terms of average family size, the demographic groups most similar to Nicaraguans are Fijian (3.36, a difference of 0.050%), Immigrants from Bangladesh (3.36, a difference of 0.070%), Korean (3.36, a difference of 0.090%), Immigrants from South Eastern Asia (3.36, a difference of 0.10%), and Immigrants from Honduras (3.36, a difference of 0.14%).
| Demographics | Rating | Rank | Average Family Size |
| Alaska Natives | 100.0 /100 | #44 | Exceptional 3.37 |
| Shoshone | 100.0 /100 | #45 | Exceptional 3.37 |
| Haitians | 100.0 /100 | #46 | Exceptional 3.37 |
| Vietnamese | 100.0 /100 | #47 | Exceptional 3.37 |
| Immigrants | Nicaragua | 100.0 /100 | #48 | Exceptional 3.37 |
| Bangladeshis | 100.0 /100 | #49 | Exceptional 3.37 |
| Immigrants | Bangladesh | 100.0 /100 | #50 | Exceptional 3.36 |
| Nicaraguans | 100.0 /100 | #51 | Exceptional 3.36 |
| Fijians | 100.0 /100 | #52 | Exceptional 3.36 |
| Koreans | 100.0 /100 | #53 | Exceptional 3.36 |
| Immigrants | South Eastern Asia | 100.0 /100 | #54 | Exceptional 3.36 |
| Immigrants | Honduras | 100.0 /100 | #55 | Exceptional 3.36 |
| Immigrants | Dominican Republic | 100.0 /100 | #56 | Exceptional 3.35 |
| Sri Lankans | 100.0 /100 | #57 | Exceptional 3.35 |
| Hondurans | 100.0 /100 | #58 | Exceptional 3.35 |