Immigrants from Kazakhstan vs French Kindergarten

COMPARE

Immigrants from Kazakhstan
Race
Ancestry
AfghanAfricanAlaska NativeAlaskan AthabascanAlbanianAleutAlsatianAmericanApacheArabArapahoArgentineanArmenianAssyrian/Chaldean/SyriacAustralianAustrianBahamianBangladeshiBarbadianBasqueBelgianBelizeanBermudanBhutaneseBlackfeetBolivianBrazilianBritishBritish West IndianBulgarianBurmeseCajunCambodianCanadianCape VerdeanCarpatho RusynCelticCentral AmericanCentral American IndianCherokeeCheyenneChickasawChileanChineseChippewaChoctawColombianColvilleComancheCosta RicanCreeCreekCroatianCrowCubanCypriotCzechCzechoslovakianDanishDelawareDominicanDutchDutch West IndianEastern EuropeanEcuadorianEgyptianEnglishEstonianEthiopianEuropeanFijianFilipinoFinnishFrench American IndianFrench CanadianGermanGerman RussianGhanaianGreekGuamanian/ChamorroGuatemalanGuyaneseHaitianHmongHonduranHopiHoumaHungarianIcelanderIndian (Asian)IndonesianInupiatIranianIraqiIrishIroquoisIsraeliItalianJamaicanJapaneseJordanianKenyanKiowaKoreanLaotianLatvianLebaneseLiberianLithuanianLumbeeLuxembourgerMacedonianMalaysianMalteseMarshalleseMenomineeMexicanMexican American IndianMongolianMoroccanNative HawaiianNavajoNepaleseNew ZealanderNicaraguanNigerianNorthern EuropeanNorwegianOkinawanOsageOttawaPaiutePakistaniPalestinianPanamanianParaguayanPennsylvania GermanPeruvianPimaPolishPortuguesePotawatomiPuebloPuerto RicanPuget Sound SalishRomanianRussianSalvadoranSamoanScandinavianScotch-IrishScottishSeminoleSenegaleseSerbianShoshoneSierra LeoneanSiouxSlavicSlovakSloveneSomaliSouth AfricanSouth AmericanSouth American IndianSoviet UnionSpaniardSpanishSpanish AmericanSpanish American IndianSri LankanSubsaharan AfricanSudaneseSwedishSwissSyrianTaiwaneseThaiTlingit-HaidaTohono O'OdhamTonganTrinidadian and TobagonianTsimshianTurkishU.S. Virgin IslanderUgandanUkrainianUruguayanUteVenezuelanVietnameseWelshWest IndianYakamaYaquiYugoslavianYumanYup'ikZimbabwean
Immigration
NonimmigrantsImmigrantsAfghanistanAfricaAlbaniaArgentinaArmeniaAsiaAustraliaAustriaBahamasBangladeshBarbadosBelarusBelgiumBelizeBoliviaBosnia and HerzegovinaBrazilBulgariaBurma/MyanmarCabo VerdeCambodiaCameroonCanadaCaribbeanCentral AmericaChileChinaColombiaCongoCosta RicaCroatiaCubaCzechoslovakiaDenmarkDominicaDominican RepublicEastern AfricaEastern AsiaEastern EuropeEcuadorEgyptEl SalvadorEnglandEritreaEthiopiaEuropeFijiFranceGermanyGhanaGreeceGrenadaGuatemalaGuyanaHaitiHondurasHong KongHungaryIndiaIndonesiaIranIraqIrelandIsraelItalyJamaicaJapanJordanKazakhstanKenyaKoreaKuwaitLaosLatin AmericaLatviaLebanonLiberiaLithuaniaMalaysiaMexicoMicronesiaMiddle AfricaMoldovaMoroccoNepalNetherlandsNicaraguaNigeriaNorth AmericaNorth MacedoniaNorthern AfricaNorthern EuropeNorwayOceaniaPakistanPanamaPeruPhilippinesPolandPortugalRomaniaRussiaSaudi ArabiaScotlandSenegalSerbiaSierra LeoneSingaporeSomaliaSouth AfricaSouth AmericaSouth Central AsiaSouth Eastern AsiaSouthern EuropeSpainSri LankaSt. Vincent and the GrenadinesSudanSwedenSwitzerlandSyriaTaiwanThailandTrinidad and TobagoTurkeyUgandaUkraineUruguayUzbekistanVenezuelaVietnamWest IndiesWestern AfricaWestern AsiaWestern EuropeYemenZaireZimbabweAzores
French
Race
Ancestry
AfghanAfricanAlaska NativeAlaskan AthabascanAlbanianAleutAlsatianAmericanApacheArabArapahoArgentineanArmenianAssyrian/Chaldean/SyriacAustralianAustrianBahamianBangladeshiBarbadianBasqueBelgianBelizeanBermudanBhutaneseBlackfeetBolivianBrazilianBritishBritish West IndianBulgarianBurmeseCajunCambodianCanadianCape VerdeanCarpatho RusynCelticCentral AmericanCentral American IndianCherokeeCheyenneChickasawChileanChineseChippewaChoctawColombianColvilleComancheCosta RicanCreeCreekCroatianCrowCubanCypriotCzechCzechoslovakianDanishDelawareDominicanDutchDutch West IndianEastern EuropeanEcuadorianEgyptianEnglishEstonianEthiopianEuropeanFijianFilipinoFinnishFrenchFrench American IndianFrench CanadianGermanGerman RussianGhanaianGreekGuamanian/ChamorroGuatemalanGuyaneseHaitianHmongHonduranHopiHoumaHungarianIcelanderIndian (Asian)IndonesianInupiatIranianIraqiIrishIroquoisIsraeliItalianJamaicanJapaneseJordanianKenyanKiowaKoreanLaotianLatvianLebaneseLiberianLithuanianLumbeeLuxembourgerMacedonianMalaysianMalteseMarshalleseMenomineeMexicanMexican American IndianMongolianMoroccanNative HawaiianNavajoNepaleseNew ZealanderNicaraguanNigerianNorthern EuropeanNorwegianOkinawanOsageOttawaPaiutePakistaniPalestinianPanamanianParaguayanPennsylvania GermanPeruvianPimaPolishPortuguesePotawatomiPuebloPuerto RicanPuget Sound SalishRomanianRussianSalvadoranSamoanScandinavianScotch-IrishScottishSeminoleSenegaleseSerbianShoshoneSierra LeoneanSiouxSlavicSlovakSloveneSomaliSouth AfricanSouth AmericanSouth American IndianSoviet UnionSpaniardSpanishSpanish AmericanSpanish American IndianSri LankanSubsaharan AfricanSudaneseSwedishSwissSyrianTaiwaneseThaiTlingit-HaidaTohono O'OdhamTonganTrinidadian and TobagonianTsimshianTurkishU.S. Virgin IslanderUgandanUkrainianUruguayanUteVenezuelanVietnameseWelshWest IndianYakamaYaquiYugoslavianYumanYup'ikZimbabwean
Immigration
NonimmigrantsImmigrantsAfghanistanAfricaAlbaniaArgentinaArmeniaAsiaAustraliaAustriaBahamasBangladeshBarbadosBelarusBelgiumBelizeBoliviaBosnia and HerzegovinaBrazilBulgariaBurma/MyanmarCabo VerdeCambodiaCameroonCanadaCaribbeanCentral AmericaChileChinaColombiaCongoCosta RicaCroatiaCubaCzechoslovakiaDenmarkDominicaDominican RepublicEastern AfricaEastern AsiaEastern EuropeEcuadorEgyptEl SalvadorEnglandEritreaEthiopiaEuropeFijiFranceGermanyGhanaGreeceGrenadaGuatemalaGuyanaHaitiHondurasHong KongHungaryIndiaIndonesiaIranIraqIrelandIsraelItalyJamaicaJapanJordanKenyaKoreaKuwaitLaosLatin AmericaLatviaLebanonLiberiaLithuaniaMalaysiaMexicoMicronesiaMiddle AfricaMoldovaMoroccoNepalNetherlandsNicaraguaNigeriaNorth AmericaNorth MacedoniaNorthern AfricaNorthern EuropeNorwayOceaniaPakistanPanamaPeruPhilippinesPolandPortugalRomaniaRussiaSaudi ArabiaScotlandSenegalSerbiaSierra LeoneSingaporeSomaliaSouth AfricaSouth AmericaSouth Central AsiaSouth Eastern AsiaSouthern EuropeSpainSri LankaSt. Vincent and the GrenadinesSudanSwedenSwitzerlandSyriaTaiwanThailandTrinidad and TobagoTurkeyUgandaUkraineUruguayUzbekistanVenezuelaVietnamWest IndiesWestern AfricaWestern AsiaWestern EuropeYemenZaireZimbabweAzores
Kindergarten
Income
Poverty
Unemployment
Labor Participation
Family Structure
Vehicle Availability
Education Level
Disability

Kindergarten Comparison

Immigrants from Kazakhstan

French

Fair
Exceptional
97.9%
KINDERGARTEN
35.9/ 100
METRIC RATING
187th/ 347
METRIC RANK
98.6%
KINDERGARTEN
100.0/ 100
METRIC RATING
29th/ 347
METRIC RANK

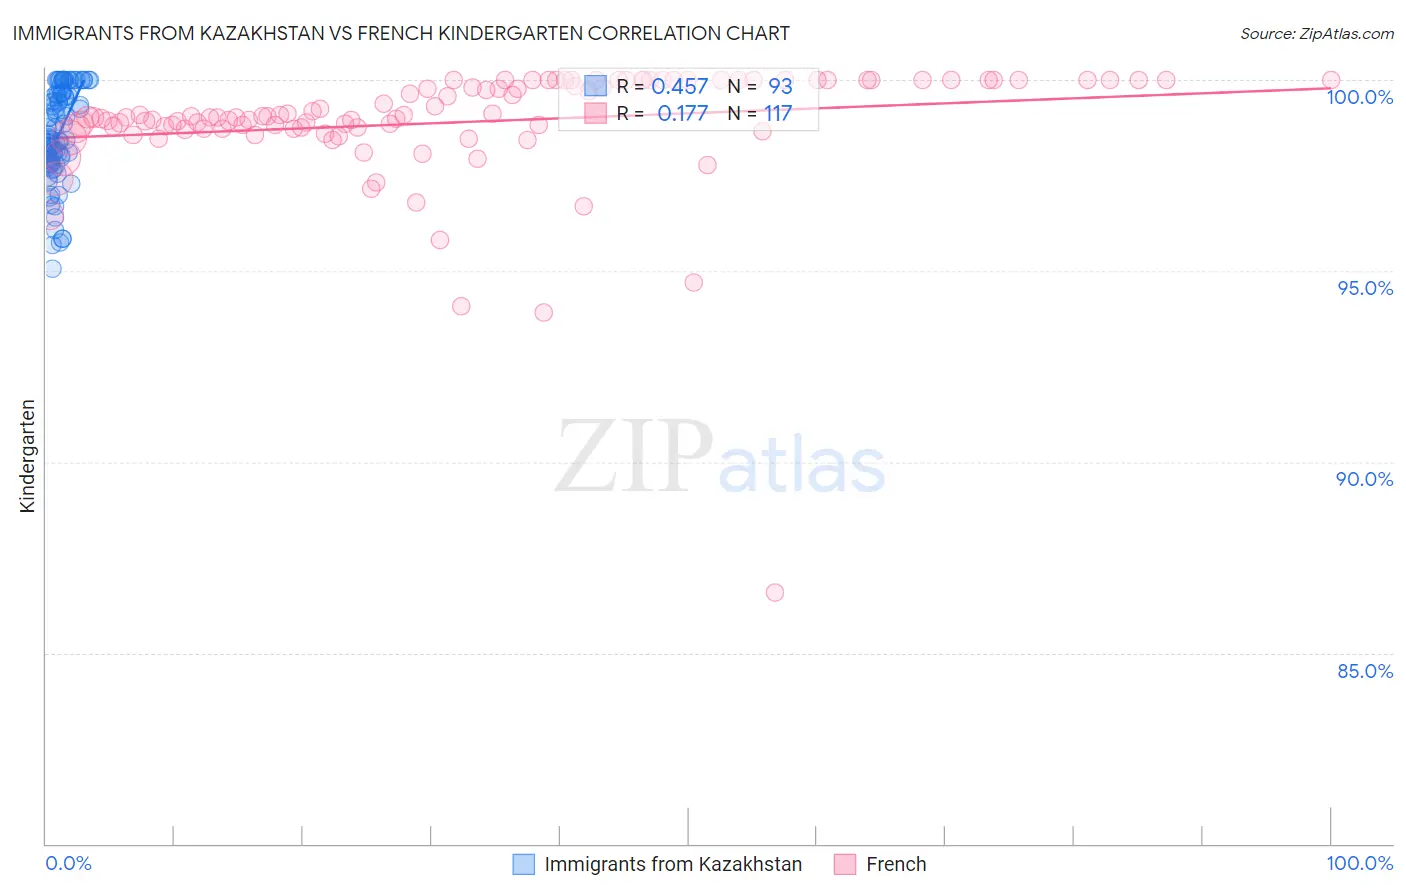
Immigrants from Kazakhstan vs French Kindergarten Correlation Chart

The statistical analysis conducted on geographies consisting of 124,444,388 people shows a moderate positive correlation between the proportion of Immigrants from Kazakhstan and percentage of population with at least kindergarten education in the United States with a correlation coefficient (R) of 0.457 and weighted average of 97.9%. Similarly, the statistical analysis conducted on geographies consisting of 572,427,269 people shows a poor positive correlation between the proportion of French and percentage of population with at least kindergarten education in the United States with a correlation coefficient (R) of 0.177 and weighted average of 98.6%, a difference of 0.68%.
Immigrants from Kazakhstan vs French Kindergarten

Kindergarten Correlation Summary

MeasurementImmigrants from KazakhstanFrench
Minimum95.1%86.6%
Maximum100.0%100.0%
Range4.9%13.4%
Mean98.6%98.9%
Median98.5%99.0%
Interquartile 25% (IQ1)97.8%98.7%
Interquartile 75% (IQ3)99.6%100.0%
Interquartile Range (IQR)1.8%1.3%
Standard Deviation (Sample)1.2%1.6%
Standard Deviation (Population)1.2%1.6%

Similar Demographics by Kindergarten

Demographics Similar to Immigrants from Kazakhstan by Kindergarten

In terms of kindergarten, the demographic groups most similar to Immigrants from Kazakhstan are Pakistani (97.9%, a difference of 0.0%), Arab (97.9%, a difference of 0.0%), Paiute (97.9%, a difference of 0.0%), Immigrants from Belarus (97.9%, a difference of 0.010%), and Panamanian (97.9%, a difference of 0.010%).
DemographicsRating | RankKindergarten
Immigrants | Bosnia and Herzegovina
46.7
/100
|
#180
Average
97.9%
Portuguese
43.5
/100
|
#181
Average
97.9%
Egyptians
42.4
/100
|
#182
Average
97.9%
Immigrants | Poland
41.4
/100
|
#183
Average
97.9%
Immigrants | Argentina
40.7
/100
|
#184
Average
97.9%
Immigrants | Belarus
39.4
/100
|
#185
Fair
97.9%
Pakistanis
36.0
/100
|
#186
Fair
97.9%
Immigrants | Kazakhstan
35.9
/100
|
#187
Fair
97.9%
Arabs
35.4
/100
|
#188
Fair
97.9%
Paiute
34.7
/100
|
#189
Fair
97.9%
Panamanians
33.3
/100
|
#190
Fair
97.9%
Immigrants | Taiwan
30.7
/100
|
#191
Fair
97.9%
Blacks/African Americans
29.9
/100
|
#192
Fair
97.9%
Paraguayans
29.6
/100
|
#193
Fair
97.9%
Hawaiians
29.3
/100
|
#194
Fair
97.9%

Demographics Similar to French by Kindergarten

In terms of kindergarten, the demographic groups most similar to French are European (98.6%, a difference of 0.0%), Croatian (98.6%, a difference of 0.010%), Czech (98.6%, a difference of 0.010%), French Canadian (98.6%, a difference of 0.010%), and Scandinavian (98.6%, a difference of 0.010%).
DemographicsRating | RankKindergarten
Finns
100.0
/100
|
#22
Exceptional
98.6%
Arapaho
100.0
/100
|
#23
Exceptional
98.6%
Danes
100.0
/100
|
#24
Exceptional
98.6%
Sioux
100.0
/100
|
#25
Exceptional
98.6%
Poles
100.0
/100
|
#26
Exceptional
98.6%
Scotch-Irish
100.0
/100
|
#27
Exceptional
98.6%
Croatians
100.0
/100
|
#28
Exceptional
98.6%
French
100.0
/100
|
#29
Exceptional
98.6%
Europeans
100.0
/100
|
#30
Exceptional
98.6%
Czechs
100.0
/100
|
#31
Exceptional
98.6%
French Canadians
100.0
/100
|
#32
Exceptional
98.6%
Scandinavians
100.0
/100
|
#33
Exceptional
98.6%
Chinese
100.0
/100
|
#34
Exceptional
98.5%
Swiss
100.0
/100
|
#35
Exceptional
98.5%
British
99.9
/100
|
#36
Exceptional
98.5%