Immigrants from Jamaica vs Immigrants from Turkey Family Households
COMPARE
Immigrants from Jamaica
Immigrants from Turkey
Family Households
Family Households Comparison
Immigrants from Jamaica
Immigrants from Turkey
64.7%
FAMILY HOUSEHOLDS
85.3/ 100
METRIC RATING
139th/ 347
METRIC RANK
63.1%
FAMILY HOUSEHOLDS
0.3/ 100
METRIC RATING
272nd/ 347
METRIC RANK
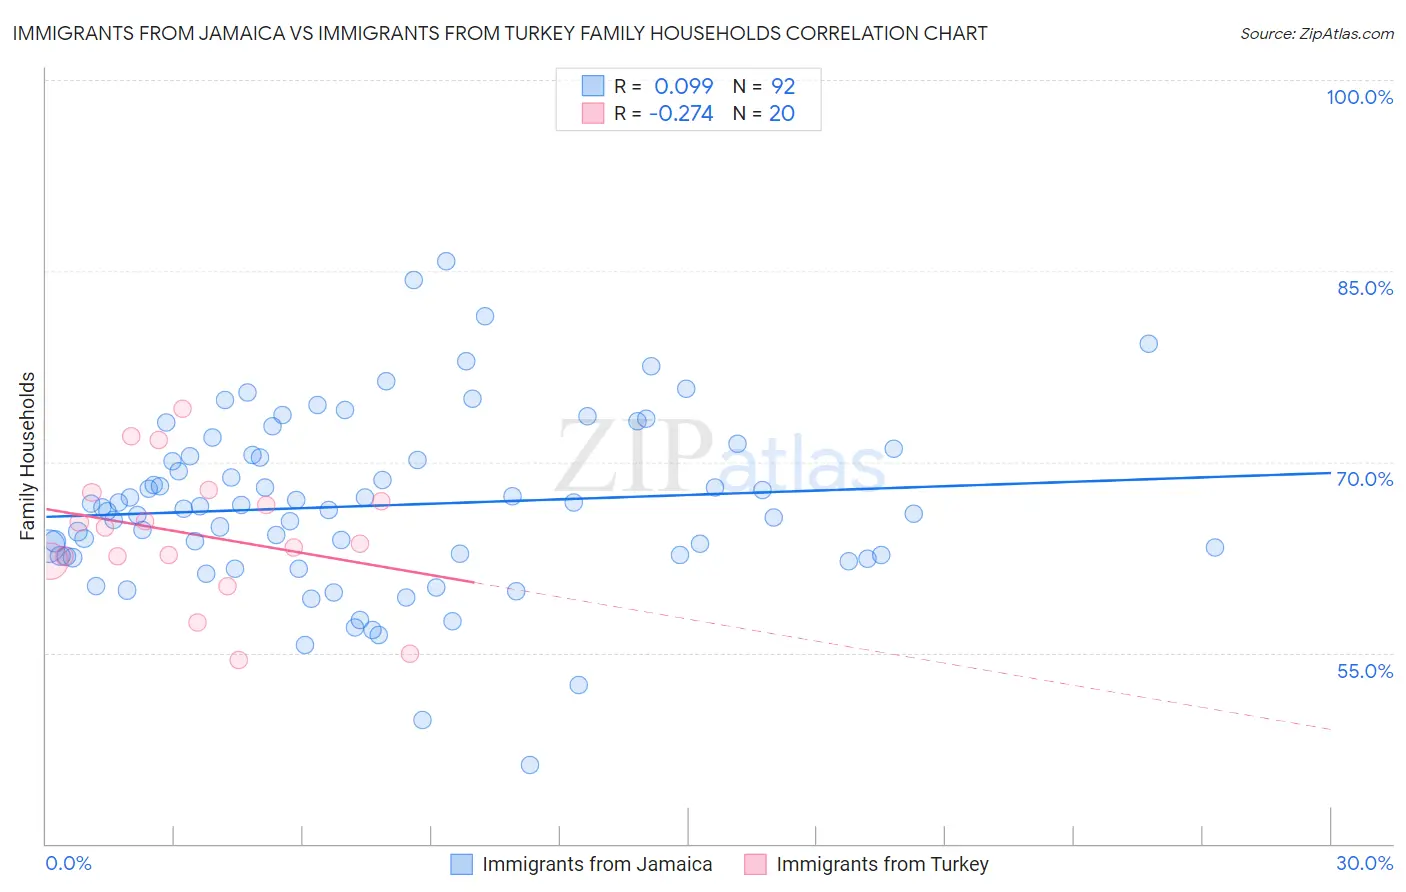
Immigrants from Jamaica vs Immigrants from Turkey Family Households Correlation Chart
The statistical analysis conducted on geographies consisting of 301,592,909 people shows a slight positive correlation between the proportion of Immigrants from Jamaica and percentage of family households in the United States with a correlation coefficient (R) of 0.099 and weighted average of 64.7%. Similarly, the statistical analysis conducted on geographies consisting of 222,976,596 people shows a weak negative correlation between the proportion of Immigrants from Turkey and percentage of family households in the United States with a correlation coefficient (R) of -0.274 and weighted average of 63.1%, a difference of 2.6%.
Family Households Correlation Summary
| Measurement | Immigrants from Jamaica | Immigrants from Turkey |
| Minimum | 46.2% | 54.4% |
| Maximum | 85.7% | 74.1% |
| Range | 39.5% | 19.7% |
| Mean | 66.6% | 64.3% |
| Median | 66.4% | 64.2% |
| Interquartile 25% (IQ1) | 62.6% | 62.4% |
| Interquartile 75% (IQ3) | 70.5% | 67.3% |
| Interquartile Range (IQR) | 7.9% | 4.9% |
| Standard Deviation (Sample) | 6.9% | 5.2% |
| Standard Deviation (Population) | 6.9% | 5.1% |
Similar Demographics by Family Households
Demographics Similar to Immigrants from Jamaica by Family Households
In terms of family households, the demographic groups most similar to Immigrants from Jamaica are Basque (64.7%, a difference of 0.010%), Immigrants from North Macedonia (64.7%, a difference of 0.010%), Immigrants from Cameroon (64.7%, a difference of 0.010%), Immigrants from China (64.7%, a difference of 0.030%), and Immigrants from Scotland (64.7%, a difference of 0.030%).
| Demographics | Rating | Rank | Family Households |
| Cajuns | 89.4 /100 | #132 | Excellent 64.8% |
| Belizeans | 89.3 /100 | #133 | Excellent 64.8% |
| Greeks | 88.1 /100 | #134 | Excellent 64.7% |
| Maltese | 87.4 /100 | #135 | Excellent 64.7% |
| Immigrants | China | 86.6 /100 | #136 | Excellent 64.7% |
| Immigrants | Scotland | 86.4 /100 | #137 | Excellent 64.7% |
| Basques | 85.5 /100 | #138 | Excellent 64.7% |
| Immigrants | Jamaica | 85.3 /100 | #139 | Excellent 64.7% |
| Immigrants | North Macedonia | 84.9 /100 | #140 | Excellent 64.7% |
| Immigrants | Cameroon | 84.8 /100 | #141 | Excellent 64.7% |
| Pakistanis | 84.0 /100 | #142 | Excellent 64.7% |
| Czechoslovakians | 82.1 /100 | #143 | Excellent 64.6% |
| South American Indians | 81.9 /100 | #144 | Excellent 64.6% |
| Welsh | 80.1 /100 | #145 | Excellent 64.6% |
| Immigrants | Romania | 77.0 /100 | #146 | Good 64.6% |
Demographics Similar to Immigrants from Turkey by Family Households
In terms of family households, the demographic groups most similar to Immigrants from Turkey are Immigrants from Croatia (63.1%, a difference of 0.0%), Immigrants from Austria (63.1%, a difference of 0.010%), Immigrants from Kazakhstan (63.1%, a difference of 0.010%), Lumbee (63.1%, a difference of 0.020%), and West Indian (63.1%, a difference of 0.020%).
| Demographics | Rating | Rank | Family Households |
| Colville | 0.5 /100 | #265 | Tragic 63.2% |
| Immigrants | Western Africa | 0.5 /100 | #266 | Tragic 63.1% |
| Israelis | 0.4 /100 | #267 | Tragic 63.1% |
| Immigrants | Singapore | 0.4 /100 | #268 | Tragic 63.1% |
| Yugoslavians | 0.4 /100 | #269 | Tragic 63.1% |
| Immigrants | Austria | 0.3 /100 | #270 | Tragic 63.1% |
| Immigrants | Croatia | 0.3 /100 | #271 | Tragic 63.1% |
| Immigrants | Turkey | 0.3 /100 | #272 | Tragic 63.1% |
| Immigrants | Kazakhstan | 0.3 /100 | #273 | Tragic 63.1% |
| Lumbee | 0.3 /100 | #274 | Tragic 63.1% |
| West Indians | 0.3 /100 | #275 | Tragic 63.1% |
| Serbians | 0.3 /100 | #276 | Tragic 63.0% |
| Ottawa | 0.3 /100 | #277 | Tragic 63.0% |
| Immigrants | Belgium | 0.2 /100 | #278 | Tragic 63.0% |
| Immigrants | Yemen | 0.2 /100 | #279 | Tragic 63.0% |