Immigrants from Western Europe vs Native/Alaskan Family Households
COMPARE
Immigrants from Western Europe
Native/Alaskan
Family Households
Family Households Comparison
Immigrants from Western Europe
Natives/Alaskans
63.2%
FAMILY HOUSEHOLDS
0.6/ 100
METRIC RATING
259th/ 347
METRIC RANK
66.4%
FAMILY HOUSEHOLDS
100.0/ 100
METRIC RATING
51st/ 347
METRIC RANK
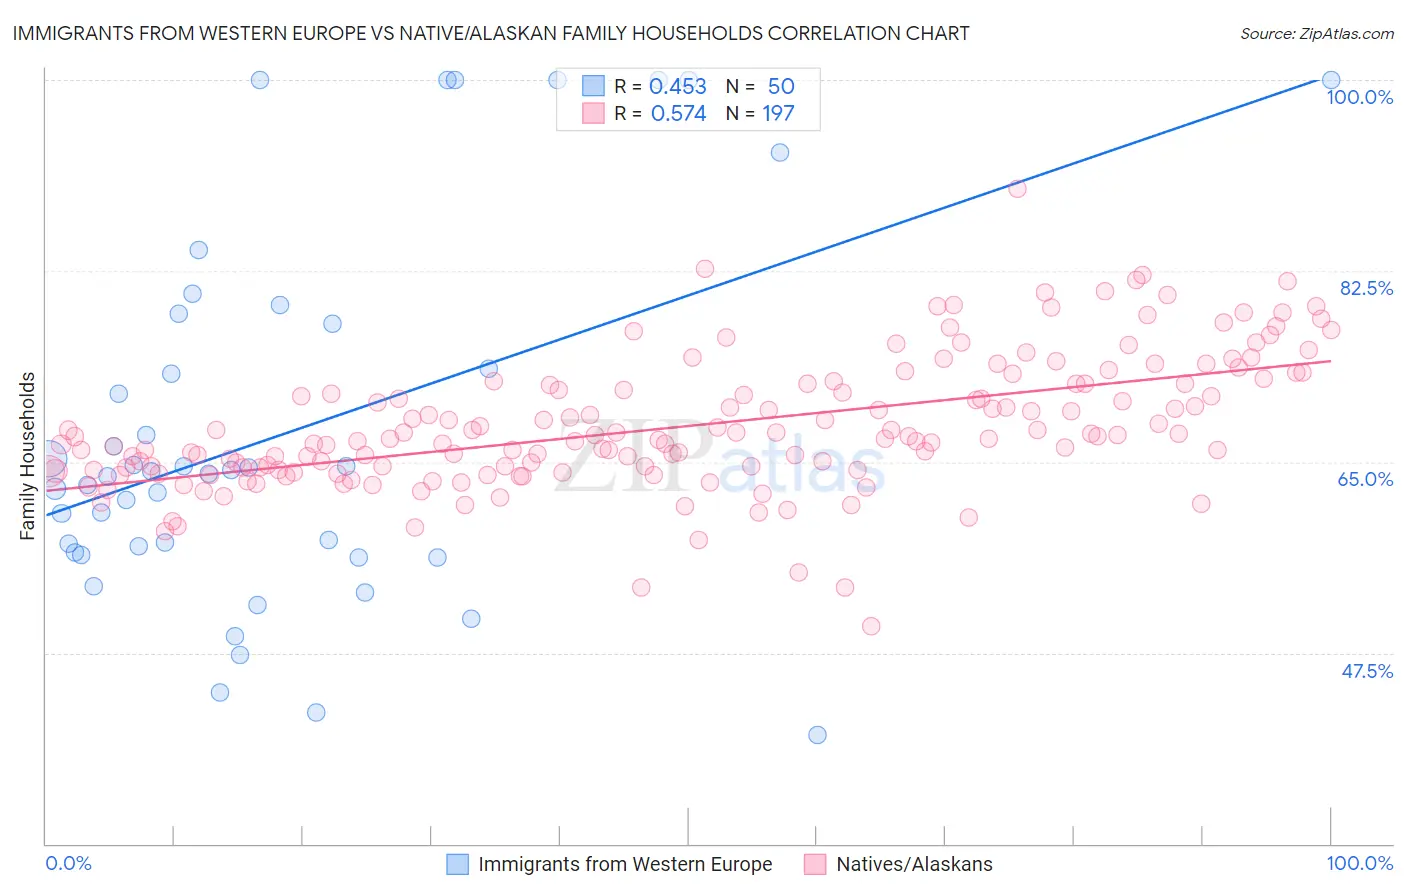
Immigrants from Western Europe vs Native/Alaskan Family Households Correlation Chart
The statistical analysis conducted on geographies consisting of 493,828,314 people shows a moderate positive correlation between the proportion of Immigrants from Western Europe and percentage of family households in the United States with a correlation coefficient (R) of 0.453 and weighted average of 63.2%. Similarly, the statistical analysis conducted on geographies consisting of 512,654,863 people shows a substantial positive correlation between the proportion of Natives/Alaskans and percentage of family households in the United States with a correlation coefficient (R) of 0.574 and weighted average of 66.4%, a difference of 5.0%.
Family Households Correlation Summary
| Measurement | Immigrants from Western Europe | Native/Alaskan |
| Minimum | 40.0% | 49.9% |
| Maximum | 100.0% | 90.0% |
| Range | 60.0% | 40.1% |
| Mean | 67.6% | 68.3% |
| Median | 64.0% | 67.2% |
| Interquartile 25% (IQ1) | 56.7% | 64.2% |
| Interquartile 75% (IQ3) | 77.7% | 72.1% |
| Interquartile Range (IQR) | 21.0% | 7.9% |
| Standard Deviation (Sample) | 16.8% | 6.0% |
| Standard Deviation (Population) | 16.6% | 6.0% |
Similar Demographics by Family Households
Demographics Similar to Immigrants from Western Europe by Family Households
In terms of family households, the demographic groups most similar to Immigrants from Western Europe are Immigrants from Barbados (63.2%, a difference of 0.010%), Cypriot (63.2%, a difference of 0.020%), Immigrants from Russia (63.2%, a difference of 0.040%), Immigrants from Ireland (63.2%, a difference of 0.050%), and Icelander (63.3%, a difference of 0.070%).
| Demographics | Rating | Rank | Family Households |
| Bahamians | 1.1 /100 | #252 | Tragic 63.3% |
| Immigrants | Dominican Republic | 1.0 /100 | #253 | Tragic 63.3% |
| Slovaks | 1.0 /100 | #254 | Tragic 63.3% |
| Potawatomi | 1.0 /100 | #255 | Tragic 63.3% |
| Luxembourgers | 0.9 /100 | #256 | Tragic 63.3% |
| Icelanders | 0.8 /100 | #257 | Tragic 63.3% |
| Immigrants | Barbados | 0.7 /100 | #258 | Tragic 63.2% |
| Immigrants | Western Europe | 0.6 /100 | #259 | Tragic 63.2% |
| Cypriots | 0.6 /100 | #260 | Tragic 63.2% |
| Immigrants | Russia | 0.6 /100 | #261 | Tragic 63.2% |
| Immigrants | Ireland | 0.6 /100 | #262 | Tragic 63.2% |
| Cheyenne | 0.5 /100 | #263 | Tragic 63.2% |
| Kenyans | 0.5 /100 | #264 | Tragic 63.2% |
| Colville | 0.5 /100 | #265 | Tragic 63.2% |
| Immigrants | Western Africa | 0.5 /100 | #266 | Tragic 63.1% |
Demographics Similar to Natives/Alaskans by Family Households
In terms of family households, the demographic groups most similar to Natives/Alaskans are Navajo (66.4%, a difference of 0.030%), Immigrants from South Central Asia (66.4%, a difference of 0.090%), Immigrants from Venezuela (66.4%, a difference of 0.14%), Colombian (66.3%, a difference of 0.14%), and Afghan (66.3%, a difference of 0.14%).
| Demographics | Rating | Rank | Family Households |
| Asians | 100.0 /100 | #44 | Exceptional 66.5% |
| Venezuelans | 100.0 /100 | #45 | Exceptional 66.5% |
| Arapaho | 100.0 /100 | #46 | Exceptional 66.5% |
| Bolivians | 100.0 /100 | #47 | Exceptional 66.5% |
| Immigrants | Venezuela | 100.0 /100 | #48 | Exceptional 66.4% |
| Immigrants | South Central Asia | 100.0 /100 | #49 | Exceptional 66.4% |
| Navajo | 100.0 /100 | #50 | Exceptional 66.4% |
| Natives/Alaskans | 100.0 /100 | #51 | Exceptional 66.4% |
| Colombians | 100.0 /100 | #52 | Exceptional 66.3% |
| Afghans | 100.0 /100 | #53 | Exceptional 66.3% |
| Immigrants | Colombia | 100.0 /100 | #54 | Exceptional 66.3% |
| Immigrants | Immigrants | 100.0 /100 | #55 | Exceptional 66.1% |
| Immigrants | Hong Kong | 100.0 /100 | #56 | Exceptional 66.1% |
| Pennsylvania Germans | 100.0 /100 | #57 | Exceptional 66.1% |
| Immigrants | Asia | 100.0 /100 | #58 | Exceptional 66.1% |