Immigrants from Jamaica vs Irish Births to Unmarried Women
COMPARE
Immigrants from Jamaica
Irish
Births to Unmarried Women
Births to Unmarried Women Comparison
Immigrants from Jamaica
Irish
38.8%
BIRTHS TO UNMARRIED WOMEN
0.0/ 100
METRIC RATING
303rd/ 347
METRIC RANK
32.2%
BIRTHS TO UNMARRIED WOMEN
32.4/ 100
METRIC RATING
191st/ 347
METRIC RANK
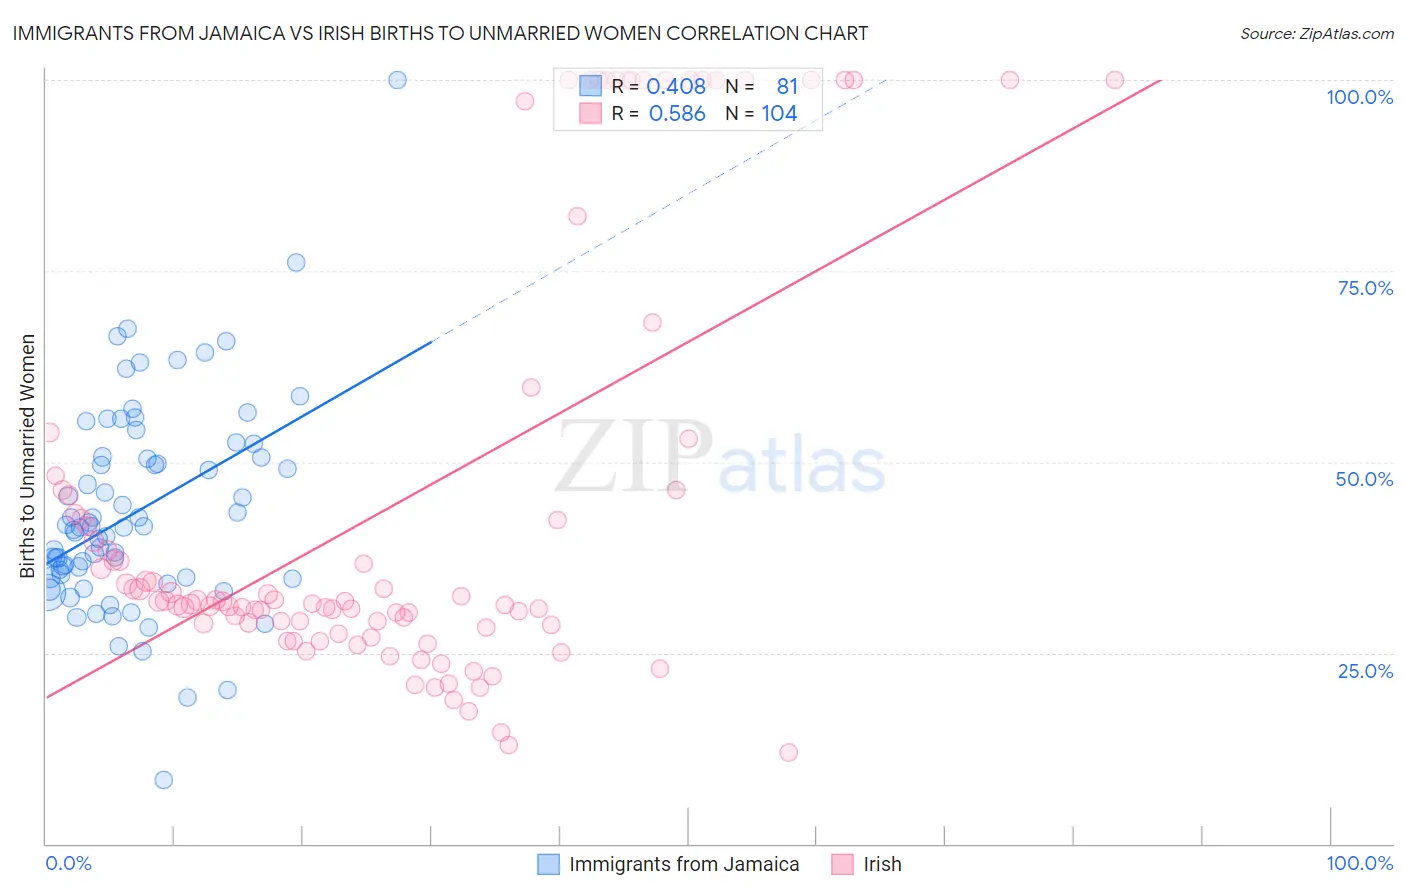
Immigrants from Jamaica vs Irish Births to Unmarried Women Correlation Chart
The statistical analysis conducted on geographies consisting of 287,311,689 people shows a moderate positive correlation between the proportion of Immigrants from Jamaica and percentage of births to unmarried women in the United States with a correlation coefficient (R) of 0.408 and weighted average of 38.8%. Similarly, the statistical analysis conducted on geographies consisting of 510,434,207 people shows a substantial positive correlation between the proportion of Irish and percentage of births to unmarried women in the United States with a correlation coefficient (R) of 0.586 and weighted average of 32.2%, a difference of 20.4%.
Births to Unmarried Women Correlation Summary
| Measurement | Immigrants from Jamaica | Irish |
| Minimum | 8.3% | 11.9% |
| Maximum | 100.0% | 100.0% |
| Range | 91.7% | 88.1% |
| Mean | 43.5% | 44.6% |
| Median | 41.4% | 31.8% |
| Interquartile 25% (IQ1) | 34.8% | 28.8% |
| Interquartile 75% (IQ3) | 50.6% | 46.3% |
| Interquartile Range (IQR) | 15.8% | 17.6% |
| Standard Deviation (Sample) | 13.7% | 28.0% |
| Standard Deviation (Population) | 13.6% | 27.9% |
Similar Demographics by Births to Unmarried Women
Demographics Similar to Immigrants from Jamaica by Births to Unmarried Women
In terms of births to unmarried women, the demographic groups most similar to Immigrants from Jamaica are Yaqui (38.8%, a difference of 0.050%), Immigrants from Haiti (38.9%, a difference of 0.15%), Honduran (38.7%, a difference of 0.32%), Central American Indian (39.0%, a difference of 0.44%), and Haitian (38.6%, a difference of 0.56%).
| Demographics | Rating | Rank | Births to Unmarried Women |
| Alaska Natives | 0.0 /100 | #296 | Tragic 38.3% |
| Dutch West Indians | 0.0 /100 | #297 | Tragic 38.4% |
| Jamaicans | 0.0 /100 | #298 | Tragic 38.5% |
| Spanish Americans | 0.0 /100 | #299 | Tragic 38.6% |
| Immigrants | West Indies | 0.0 /100 | #300 | Tragic 38.6% |
| Haitians | 0.0 /100 | #301 | Tragic 38.6% |
| Hondurans | 0.0 /100 | #302 | Tragic 38.7% |
| Immigrants | Jamaica | 0.0 /100 | #303 | Tragic 38.8% |
| Yaqui | 0.0 /100 | #304 | Tragic 38.8% |
| Immigrants | Haiti | 0.0 /100 | #305 | Tragic 38.9% |
| Central American Indians | 0.0 /100 | #306 | Tragic 39.0% |
| Immigrants | Honduras | 0.0 /100 | #307 | Tragic 39.3% |
| Aleuts | 0.0 /100 | #308 | Tragic 39.3% |
| Cubans | 0.0 /100 | #309 | Tragic 39.4% |
| Immigrants | Dominica | 0.0 /100 | #310 | Tragic 39.5% |
Demographics Similar to Irish by Births to Unmarried Women
In terms of births to unmarried women, the demographic groups most similar to Irish are Tlingit-Haida (32.2%, a difference of 0.020%), Colombian (32.2%, a difference of 0.050%), Fijian (32.3%, a difference of 0.14%), Immigrants from Kenya (32.1%, a difference of 0.46%), and Osage (32.1%, a difference of 0.49%).
| Demographics | Rating | Rank | Births to Unmarried Women |
| Immigrants | South America | 40.7 /100 | #184 | Average 32.0% |
| Germans | 39.5 /100 | #185 | Fair 32.0% |
| Welsh | 38.2 /100 | #186 | Fair 32.0% |
| Czechoslovakians | 38.0 /100 | #187 | Fair 32.0% |
| Osage | 37.1 /100 | #188 | Fair 32.1% |
| Immigrants | Kenya | 36.9 /100 | #189 | Fair 32.1% |
| Tlingit-Haida | 32.6 /100 | #190 | Fair 32.2% |
| Irish | 32.4 /100 | #191 | Fair 32.2% |
| Colombians | 31.9 /100 | #192 | Fair 32.2% |
| Fijians | 31.1 /100 | #193 | Fair 32.3% |
| Sudanese | 27.3 /100 | #194 | Fair 32.4% |
| Samoans | 21.9 /100 | #195 | Fair 32.6% |
| Immigrants | Colombia | 21.7 /100 | #196 | Fair 32.6% |
| Immigrants | Immigrants | 20.6 /100 | #197 | Fair 32.7% |
| Costa Ricans | 20.3 /100 | #198 | Fair 32.7% |