Immigrants from Jamaica vs Immigrants from Chile Births to Unmarried Women
COMPARE
Immigrants from Jamaica
Immigrants from Chile
Births to Unmarried Women
Births to Unmarried Women Comparison
Immigrants from Jamaica
Immigrants from Chile
38.8%
BIRTHS TO UNMARRIED WOMEN
0.0/ 100
METRIC RATING
303rd/ 347
METRIC RANK
31.2%
BIRTHS TO UNMARRIED WOMEN
65.7/ 100
METRIC RATING
163rd/ 347
METRIC RANK
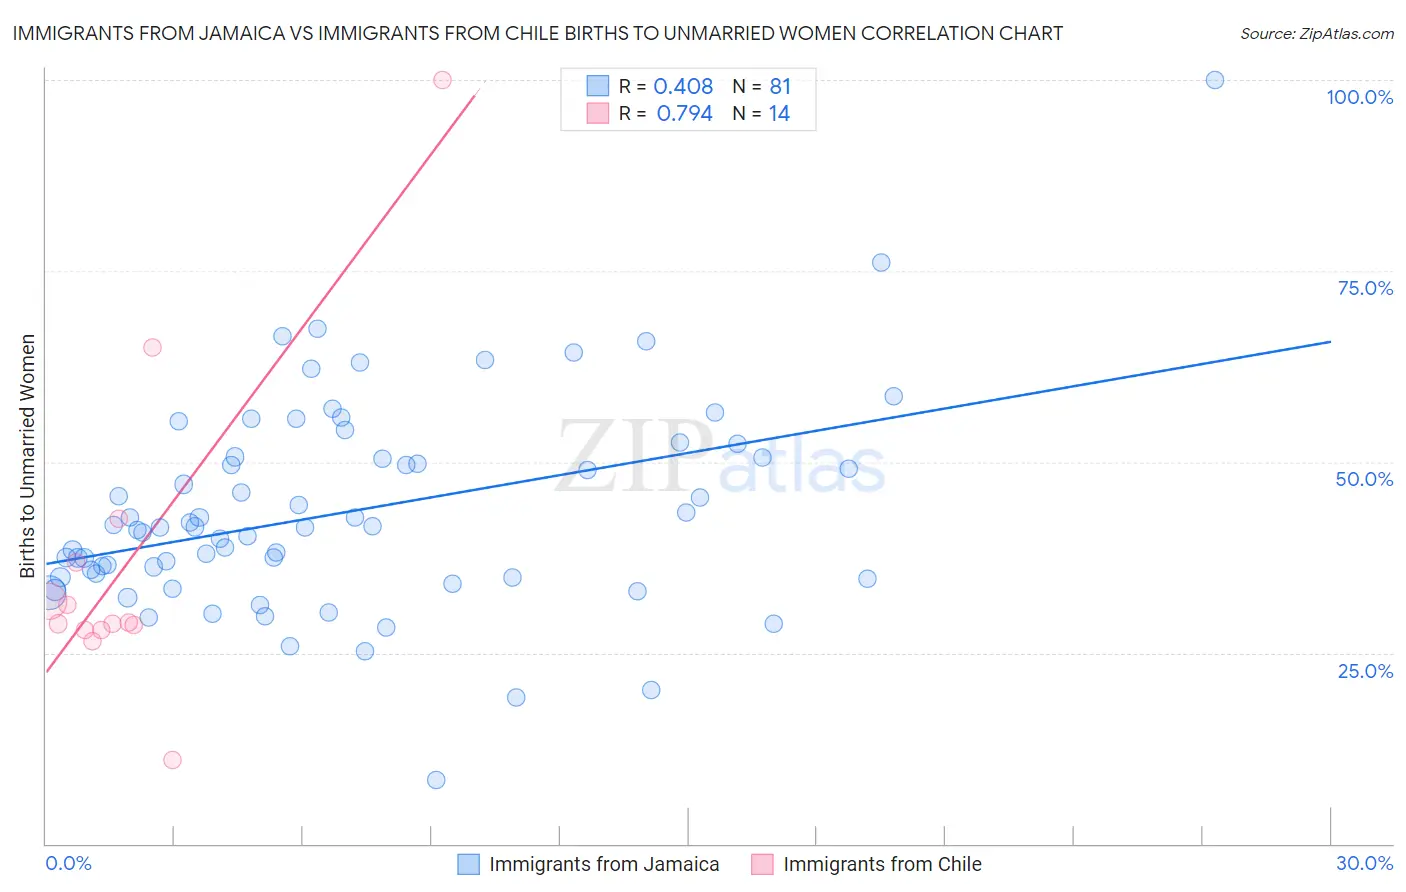
Immigrants from Jamaica vs Immigrants from Chile Births to Unmarried Women Correlation Chart
The statistical analysis conducted on geographies consisting of 287,311,689 people shows a moderate positive correlation between the proportion of Immigrants from Jamaica and percentage of births to unmarried women in the United States with a correlation coefficient (R) of 0.408 and weighted average of 38.8%. Similarly, the statistical analysis conducted on geographies consisting of 209,837,772 people shows a strong positive correlation between the proportion of Immigrants from Chile and percentage of births to unmarried women in the United States with a correlation coefficient (R) of 0.794 and weighted average of 31.2%, a difference of 24.4%.
Births to Unmarried Women Correlation Summary
| Measurement | Immigrants from Jamaica | Immigrants from Chile |
| Minimum | 8.3% | 10.9% |
| Maximum | 100.0% | 100.0% |
| Range | 91.7% | 89.1% |
| Mean | 43.5% | 36.8% |
| Median | 41.4% | 28.9% |
| Interquartile 25% (IQ1) | 34.8% | 28.0% |
| Interquartile 75% (IQ3) | 50.6% | 36.8% |
| Interquartile Range (IQR) | 15.8% | 8.9% |
| Standard Deviation (Sample) | 13.7% | 21.6% |
| Standard Deviation (Population) | 13.6% | 20.8% |
Similar Demographics by Births to Unmarried Women
Demographics Similar to Immigrants from Jamaica by Births to Unmarried Women
In terms of births to unmarried women, the demographic groups most similar to Immigrants from Jamaica are Yaqui (38.8%, a difference of 0.050%), Immigrants from Haiti (38.9%, a difference of 0.15%), Honduran (38.7%, a difference of 0.32%), Central American Indian (39.0%, a difference of 0.44%), and Haitian (38.6%, a difference of 0.56%).
| Demographics | Rating | Rank | Births to Unmarried Women |
| Alaska Natives | 0.0 /100 | #296 | Tragic 38.3% |
| Dutch West Indians | 0.0 /100 | #297 | Tragic 38.4% |
| Jamaicans | 0.0 /100 | #298 | Tragic 38.5% |
| Spanish Americans | 0.0 /100 | #299 | Tragic 38.6% |
| Immigrants | West Indies | 0.0 /100 | #300 | Tragic 38.6% |
| Haitians | 0.0 /100 | #301 | Tragic 38.6% |
| Hondurans | 0.0 /100 | #302 | Tragic 38.7% |
| Immigrants | Jamaica | 0.0 /100 | #303 | Tragic 38.8% |
| Yaqui | 0.0 /100 | #304 | Tragic 38.8% |
| Immigrants | Haiti | 0.0 /100 | #305 | Tragic 38.9% |
| Central American Indians | 0.0 /100 | #306 | Tragic 39.0% |
| Immigrants | Honduras | 0.0 /100 | #307 | Tragic 39.3% |
| Aleuts | 0.0 /100 | #308 | Tragic 39.3% |
| Cubans | 0.0 /100 | #309 | Tragic 39.4% |
| Immigrants | Dominica | 0.0 /100 | #310 | Tragic 39.5% |
Demographics Similar to Immigrants from Chile by Births to Unmarried Women
In terms of births to unmarried women, the demographic groups most similar to Immigrants from Chile are Slovene (31.2%, a difference of 0.020%), Hungarian (31.2%, a difference of 0.17%), Immigrants from Southern Europe (31.1%, a difference of 0.33%), Immigrants from England (31.1%, a difference of 0.40%), and Immigrants from Western Europe (31.1%, a difference of 0.40%).
| Demographics | Rating | Rank | Births to Unmarried Women |
| Carpatho Rusyns | 73.5 /100 | #156 | Good 30.9% |
| Immigrants | Eastern Africa | 72.1 /100 | #157 | Good 31.0% |
| Austrians | 69.9 /100 | #158 | Good 31.0% |
| Immigrants | England | 69.4 /100 | #159 | Good 31.1% |
| Immigrants | Western Europe | 69.3 /100 | #160 | Good 31.1% |
| Immigrants | Southern Europe | 68.7 /100 | #161 | Good 31.1% |
| Slovenes | 65.9 /100 | #162 | Good 31.2% |
| Immigrants | Chile | 65.7 /100 | #163 | Good 31.2% |
| Hungarians | 64.1 /100 | #164 | Good 31.2% |
| Immigrants | Somalia | 58.1 /100 | #165 | Average 31.4% |
| Peruvians | 55.5 /100 | #166 | Average 31.5% |
| Dutch | 55.3 /100 | #167 | Average 31.5% |
| Belgians | 52.4 /100 | #168 | Average 31.6% |
| Slavs | 52.0 /100 | #169 | Average 31.6% |
| Guamanians/Chamorros | 51.3 /100 | #170 | Average 31.6% |